


If you could only see eight numbers from each of your venues every week, which eight would you pick?
It's a harder question than it sounds. Most multi-site groups don't struggle because they're short on data. They struggle because they have too much of it: a sales report from the POS, a wages report from rostering, a stock sheet from every head chef, and a dashboard someone built last year that nobody quite trusts. Every one of those numbers made sense when it was added. Put together, they make it surprisingly hard to see which venue actually needs you this week.
For a long time, our answer while we were growing to 12 venues was basically "all of them". Our management meetings showed it. We'd spend most of the hour with managers explaining their numbers, and very little of it deciding what to change or do next. What turned that around wasn't more reporting. It was choosing a short list of the numbers that mattered, that every venue reported the same way, with one person owning each number and a clear line for when it needed action.
This guide is our answer to that question. It covers the eight KPIs I'd ask every venue in a multi-site group to report weekly, what each one tells you, who should own it, and when it should trigger a conversation. It's written for groups running cafes, restaurants, pubs and bars. If you also run accommodation, add occupancy, average daily rate and RevPAR for those sites.
Key takeaways
- Track these eight numbers per venue every week: sales vs budget, covers and average spend, labour % actual vs target, sales per labour hour, total cost of goods %, prime cost vs target, wastage and variance on your top 10 sellers, and guest rating.
- Measure each venue against its own targets, not against the group average or generalised benchmarks.
- Give every KPI an owner and an action line, and colour-code it red, amber or green, so the weekly meeting is about fixes and actions.
- Get the scorecard out within one business day of the week closing, with the same cut-off at every venue.
- Weekly catches problems while they're still small. A one-point labour drift on $50,000 a week costs $26,000 a year for a single venue.
What KPIs should multi-site hospitality groups track every week?
Every venue in the group should report the same eight KPIs each week: sales against budget, covers and average spend, actual labour cost percentage against target, sales per labour hour, total food and beverage cost of goods percentage, prime cost against the venue's own target, wastage and stock variance on your top 10 selling food and beverage items, and a guest rating. Together they show whether demand, labour, stock and the guest experience are on track, on a single page.
| KPI | What it tells you | Who owns it | When to act (starting point) |
|---|---|---|---|
| 1. Sales vs budget (and same week last year) | Whether customer demand is where you planned it to be | Venue manager | 5% or more under budget, or under two weeks in a row |
| 2. Covers and average spend | Whether a sales gap is fewer guests or lower spend per guest (sales = covers × average spend) | Venue manager and front-of-house lead | Average spend down three weeks in a row |
| 3. Labour %: actual vs target | Whether shifts were managed to reflect how sales were performing | Venue manager and head chef | 2 points or more over the venue's target |
| 4. Sales per labour hour | How productive the hours were, comparable across venues of different sizes | Venue manager and head chef | 10% or more below the venue's own recent average |
| 5. Total food and beverage cost of goods % | Whether margin is holding, across both the kitchen and the bar | Head chef and bar manager | 2 points or more over the venue's target |
| 6. Prime cost % vs target | The combined result of labour and cost of goods | Group GM, venue manager and head chef | Over target two weeks in a row |
| 7. Wastage and variance on your top 10 selling food and beverage items | Whether your biggest sellers are being portioned and poured correctly | Head chef and bar manager | Top 10 items exceed $200 in total variance |
| 8. Guest rating (reviews and feedback) | Early warning on guest sentiment and forward sales | Venue manager and group GM | Rolling rating drops, or the same complaint shows up twice |
The action lines are starting points, not rules. Set your own from each venue's history once you've run the scorecard for a few weeks.
There's a reason it's these eight. The first two tell you about demand. Three and four tell you about labour. Five tells you whether margin is holding across the kitchen and the bar. Six brings labour and stock together into the number that decides whether the venue made money. Seven shows whether your biggest sellers are leaking through waste, over-portioning or heavy pours, and eight is your early warning on how guests feel, which usually shows up in sales a few weeks later. Pretty much everything else either belongs in a daily report or waits for the monthly P&L.
Variance on number seven is the gap between what your top 10 items should have used, based on what you sold and your recipes, and what you actually used according to your stock counts. Sticking to your top 10 food and beverage sellers keeps the count quick, and it's usually where the biggest gains are. It's also where you find out whether a cost of goods problem is in the kitchen or behind the bar. A simple dollar line keeps it practical: once the total variance across those 10 items goes over $200 in a week, it's a conversation.
Why should hospitality groups review KPIs weekly instead of monthly?
Because a month is too long to let a problem run. By the time the monthly P&L lands, the month you'd want to fix is over and the next one is half gone. A weekly scorecard catches a problem while it's still a few hundred dollars, not a few thousand.
Take a venue turning over $50,000 a week with labour running one percentage point over target. That's $500 in extra wages for the week. Nobody notices $500 in a week, which is exactly the problem. Here's what it adds up to if it runs undetected:
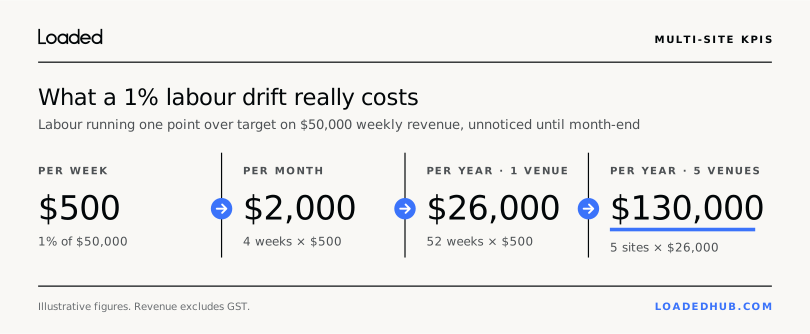
One point, at one venue, is $26,000 a year. Across five venues it's $130,000. And one point is a small miss. It's common to find at least one venue in a group running 7 or 8 points off on labour or stock without anyone having flagged it.
On the scorecard, one point over shows as amber, not red, because the action line for labour is two points. That's deliberate. One amber week is something to watch. Amber two weeks running turns red, which is how a one-point drift gets caught in a fortnight instead of costing you $26,000 over a year.
Weekly is also the speed hospitality actually runs at. Rosters are built weekly, stock is ordered weekly, and managers plan their lives in weeks. Monthly is too slow to change anything. Weekly is the right speed for decisions.
That doesn't mean ignoring the daily numbers. The habit that made the biggest difference across our venues was a simple daily labour rule for managers, which we cover in our guide to tracking prime cost across multiple venues. The daily rule keeps each week on track. The weekly scorecard tells you which venue needs the most focus and attention.
How many KPIs should a hospitality group track?
Fewer than you think. Eight weekly KPIs per venue is plenty. Once you go much beyond ten, managers stop reading past the first page, meetings turn into debates about which report is right, and the numbers that matter get buried under the ones that don't.
It creeps up on you. Every time something goes wrong, someone builds a report so it doesn't happen again. A discount report, then a comps report, then labour by hour, then sales by category, then a dashboard on top of all of it. Each one makes sense on its own. Put together, they leave a venue manager staring at a wall of numbers and no idea which three they're actually accountable for.
The goal isn't to measure everything. It's to know where to look first. These are worth tracking, just not on the weekly venue scorecard:
- Net profit and EBITDA, both as a $ and %. These need a finished P&L, so they belong in the monthly review.
- Individual menu item margins. These are important, but they're a menu review or a project, not a weekly number. Start with your top five sellers.
- Sales by hour and by category. Managers use these daily to build rosters and run shifts, but they're operational tools rather than reports.
- Table turns. These move slowly and matter far more for some formats than others.
- Cash. Owners should check it daily, but on their own view, not the venue scorecard. More on that in the FAQs.
None of these are bad numbers. They just run at a different speed or belong to a different person, and mixing them into the weekly report is how the important numbers get lost.
What does a good weekly KPI report look like for multiple venues?
It's one page, with every venue in its own row, the same KPIs in the same order, each one shown against that venue's own target, colour-coded red, amber or green, and the gaps flagged with their dollar impact. You should be able to see within a minute which venues need a conversation and what about.
Colour-coding makes the page read itself:
- Green: on or better than target.
- Amber: off target, but still inside the action line.
- Red: past the action line, or amber two weeks running.
Here's an example week for a four-venue group (the core columns only):
| Venue | Sales (vs budget) | Labour %: actual (target) | Cost of goods % (target) | Prime cost % (target) | Status and flag this week |
|---|---|---|---|---|---|
| Cafe | $28,500 (-5%) | 26% (25%) | 34% (35%) | 60% (60%) | Red: sales 5% under budget. Check covers vs average spend |
| Pub | $63,000 (+5%) | 27% (28%) | 31% (30%) | 58% (58%) | Amber: cost of goods 1 point over, $630 |
| Fine dining restaurant | $44,100 (-2%) | 34% (32%) | 24% (24%) | 58% (56%) | Red: labour 2 points over, $882 |
| Casual restaurant | $51,000 (+2%) | 28% (28%) | 28% (28%) | 56% (56%) | Green. Well done |
| Group (add the dollars) | $186,600 (+0.9%) | 28.8% | 29.0% | 57.8% (57.3% blended) | $882 over target |
Read it venue by venue:
- The fine dining restaurant is this week's main conversation. Sales came in a little under budget and labour didn't come down with them. Two points over is right on the action line, so it's red. That's a roster that didn't flex, and it cost $882 this week. It's a conversation for the venue manager and the head chef together, because the kitchen roster is a big part of that wage bill.
- The cafe is red on sales. It missed budget by 5% but held its prime cost, so the money side is fine for now. The question is whether that's fewer guests or lower spend per guest, which is exactly why covers and average spend sit on the scorecard. Fewer covers is a marketing or reputation question. Lower spend is a service and upselling question.
- The pub's prime cost is right on target, but cost of goods shows amber. Strong sales pulled labour a point under target, which covered a cost of goods problem a point over. One amber week isn't a crisis, but when sales soften, the labour win disappears and the stock problem will still be there. That's $630 a week. Check the pub's top 10 variance to see whether it's coming from the kitchen or the bar, and if it's still amber next week, it turns red.
- The casual restaurant is green across the board. There's nothing to discuss, so send the manager a quick note to say well done and move on.
At the group level, sales were nearly 1% ahead of budget and prime cost was half a point over the blended target. On its own, the group line looks fine. The venue rows are where the story is. That's why every venue needs its own row and its own targets. Always add up the dollars across venues before working out the group percentage, so a small venue doesn't carry the same weight as your biggest one. And if you've opened a venue in the last year, report like-for-like sales (venues trading in both years) separately, so a new site doesn't make the rest of the group look better than it is.
Every red number needs an owner and a next step before the meeting ends. It also helps to show a four-week rolling average next to this week's number, so one strange week doesn't cause an overreaction.
How do you calculate sales per labour hour?
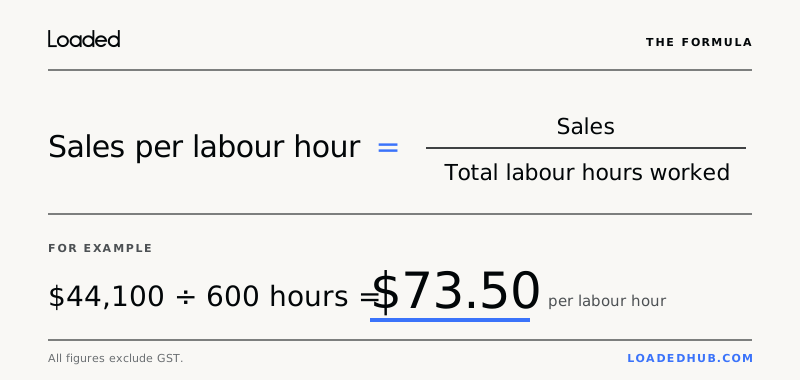
Divide a venue's sales (excluding GST) by the total labour hours worked in the same period. A venue that took $44,100 last week and worked 600 hours ran at $73.50 per labour hour. Compare each venue against its own recent average rather than against other venues, because format and price point drive the number.
It earns its spot next to labour percentage because the two can tell different stories. Labour percentage can improve without anyone rostering better. A big Saturday can flatter it, and so can a week where a few senior staff were away and juniors covered their shifts. Sales per labour hour asks a simpler question: did each hour on the roster produce more or less than usual? If labour percentage dropped but sales per labour hour didn't move, the roster didn't actually get tighter. Look at front-of-house and kitchen hours separately too, so the venue manager and head chef can each see their part of it.
A few rules keep it useful:
- Use hours actually worked from timesheets, not rostered hours.
- Decide once whether salaried managers' and chefs' hours are in or out, then do it the same way at every venue.
- Look at the trend over four to six weeks. One week on its own can be noisy.
For more on the cost side of labour, see our guides on how to calculate labour cost percentage and labour cost benchmarks by venue type.
How do you set KPI targets for venues that trade differently?
Set targets venue by venue, based on each venue's own history and format, not one number for the whole group. A cafe and a fine dining restaurant get to a healthy prime cost by completely different routes, so a single labour or food cost target will have you chasing the wrong venue every week.
A simple way to start:
- Start from the venue's last 12 months. That's its real baseline, seasons included.
- Set the improvement you want on top. Half a point to a point at a time is realistic. Bigger jumps usually mean the target gets ignored.
- Budget sales and labour by week, not by month. Build in public holidays, school holidays and local events, because they move trade more than almost anything else. They move wages too. In Australia, weekend and public holiday penalty rates under the awards lift the cost of those shifts, and in New Zealand staff who work a public holiday are paid time and a half, plus an alternative day off if it falls on a day they'd normally work. Build that into that week's labour target, rather than marking a venue red for paying what it legally owes.
- Compare to last year by trading days, not calendar dates. A month with an extra weekend, or Easter landing in a different month, can make a perfectly normal week look like a disaster or a triumph.
The split inside prime cost matters too. Cafes usually run higher cost of goods and leaner labour, and fine dining runs the opposite. We go through how to set that split for each venue type in How to Track Prime Cost Across Multiple Venues, and the benchmark ranges are in our food cost percentage guide.
How should you run a weekly KPI meeting with venue managers?
Keep it short and built around exceptions. Get the scorecard out within one business day of the week closing. Managers and head chefs then add a one-line comment on anything red before they arrive. The meeting covers only the flagged numbers, and every flag leaves the room with an owner and a next step. Venues in the green get a quick well done and no airtime.
Our management meetings got noticeably better the day we asked managers to fill in a simple template before they walked in. Until then, everyone arrived with different levels of preparation and different ideas about what mattered that week, so we spent most of the hour working out what had happened instead of deciding what to do about it. Once the numbers and the "why" were on the page beforehand, the meeting could start at the fix.
A simple agenda that works:
- Scorecard on the screen (5 minutes). Everyone looks at the same page. Nobody brings their own version.
- Red numbers only (about 5 minutes per venue). What happened, what's the fix, who owns it and by when.
- Ambers from last week. Anything amber two weeks running is now red, so check it's been picked up.
- Last week's actions. Done or not done. If not, why not?
- One win to share. Something a venue did well that the others can copy.
The follow-up matters as much as the meeting. When we got serious about managers owning their labour numbers day to day, it was worth around $30,000 a year for every $1 million in revenue. The weekly meeting is where that ownership gets checked.
If you want the template we used, it's in our guide on how to run management meetings that don't suck, with a free weekly meeting template you can print and use fresh each week.
How does Loaded help multi-site groups track weekly KPIs?
Loaded brings sales from your POS together with labour from your rosters and timesheets and cost of goods from your invoices and stocktakes, and combines it all with Loaded's back-office tools and insights. Everything sits in one place for every venue, calculated the same way at every site. The weekly scorecard builds as each day happens and is ready as the week closes, instead of someone in the office spending hours pulling it together.
We built Loaded because we couldn't get this view of our own 12 venues. Our numbers were late, they didn't always agree, and by the time we knew whether a week had been good or bad, it was already over. Once revenue, labour and cost of goods were in one place, live and consistent across every site, our net profit moved from around 5% to 13 to 14%. That came from finally seeing what was happening while there was still time to act on it, not from a jump in sales.
In practice, that means:
- Labour against sales every day, for every venue, so managers can run the daily labour rule and the weekly labour numbers take care of themselves.
- Sales per labour hour, covers and average spend for every venue, so you can see whether a sales gap is fewer guests or lower spend, and whether the roster really got tighter.
- Invoices processed automatically by Loaded AI and checked as they arrive, with alerts when a supplier's price changes, so cost of goods is accurate before the weekly count.
- Variance on your top-selling items, comparing what your recipes and sales say you should have used with what your stock counts show, so you know whether a problem is in the kitchen or behind the bar.
- Every venue side by side, on all of the above, using the same definitions everywhere.
If you're still working out which system should hold all of this, our guide to hospitality reporting software for multi-site venues covers what to look for.
How do I set up a weekly KPI scorecard for my venues?
Start with the eight KPIs above, define each one the same way at every venue, set targets venue by venue, give every KPI an owner and an action line, then run the one-page scorecard for four weeks before changing anything.
- Agree the definitions. Sales excluding GST. Labour including on-costs (super or KiwiSaver, payroll tax where it applies, workers' compensation or ACC). Cost of goods covering both food and beverage. The same week ending, the same cut-off time and the same stock count day at every venue.
- Set each venue's targets from its own history, with the split between labour and cost of goods that suits how it trades.
- Write the action line and the owners next to each KPI, so nobody has to guess whether a number matters or whose it is.
- Build the one-page scorecard with venues as rows, red, amber and green status, and the group total at the bottom, adding up dollars rather than averaging percentages. Our multisite Group P&L template uses the same layout for the monthly view.
- Send it within one business day of the week closing, then run it for four weeks before you tweak it. You'll learn more from a month of using it than from a week of designing it.
Where to go next:
- If you're rolling out a new reporting setup, seven multi-venue reporting implementation challenges covers the common traps.
- If you want to go deeper on comparing venues, see how to compare restaurant performance across multiple venues.
- If you're comparing options now, see how Loaded stacks up as a Supy alternative or a Restoke alternative.
Restaurant and hospitality group KPI FAQs
What are the most important KPIs for a restaurant group?
If you only track three, make them sales against budget, labour percentage against target, and prime cost against each venue's own target. Sales tells you whether demand is there, labour is the cost that moves fastest, and prime cost tells you whether the venue is actually making money on its two biggest controllable costs.
Should every venue have the same KPIs?
Yes, every venue should report the same KPIs with the same definitions, but each venue should have its own targets. Same KPIs make venues comparable. Different targets stop you holding a cafe and a fine dining restaurant to a number that only suits one of them.
What's the difference between theoretical and actual food cost?
Theoretical food cost is what your food should have cost, based on what you sold and your recipes. Actual food cost is what you really used: opening stock, plus purchases, minus closing stock. The gap between them is your variance, and it usually comes from waste, over-portioning, theft, recipe errors or counting mistakes. Tracking it weekly on your top 10 sellers shows you exactly where to look.
How quickly should a weekly KPI report be ready?
Within one business day of the week closing. Use the same cut-off time at every venue, and accept that a fast report that's nearly perfect beats a perfect one that arrives on Thursday. The older the numbers are when you meet, the less of the problem you can still fix.
Should cash be on the weekly KPI scorecard?
No. Owners should check cash daily, along with upcoming payroll, GST and supplier payments, but keep it on the owner and finance view rather than the venue scorecard. Venue managers can't control the bank balance. They control sales, labour and stock, which is what drives it.
What's a good sales per labour hour for a restaurant in Australia or New Zealand?
There's no single good number, because format, price point and service style drive it. A high-volume cafe and a fine dining restaurant will sit in very different places. Track each venue against its own four to six week average and act when it drops 10% or more below that.
How do you compare this week to the same week last year?
Match by trading days and events, not calendar dates. Compare a week with a public holiday to last year's matching holiday week, and allow for Easter and school holidays moving between months. Otherwise an extra weekend or a moved holiday can make a normal week look like a big win or a big miss.
Who should own weekly KPIs in a hospitality group?
Venue managers own sales, covers and average spend, and guest rating. Labour and sales per labour hour are shared between the venue manager and the head chef, because the kitchen roster is a big part of the wage bill. Head chefs and bar managers own cost of goods and variance on the top 10 sellers. Prime cost is shared by the group GM, venue manager and head chef, and the group GM makes sure every red number leaves the weekly meeting with a fix and a date.
Should head office see the same KPI report as venue managers?
Use the same scorecard so everyone is working from one version of the truth, but at different depths. Venue managers and head chefs need their own venue in detail plus their daily numbers. Owners need every venue side by side each week, cash every day, then the full group P&L each month.
Want to see your own venues on one page, with numbers you can actually trust? Book a free, zero-pressure 30-minute demo and we'll walk through your current setup, not a generic pitch.
See how Loaded can work for your business
If you’ve never seen Loaded in action, jump over and book a demo with us. 30 minutes is all we’ll need to show you the magic!


More Profit
Making money doesn’t happen by accident! Learn how to tune your business and improve your bottom-line.



More Success Stories
Get inspired by stories from real Loaded customers who run thriving hospitality businesses.




More Labour
Get tips for optimising your staff’s time, and for managing your team effectively.


.jpg)
More Culture
Making money doesn’t happen by accident! Learn how to tune your business and improve your bottom-line.



More Design
Making money doesn’t happen by accident! Learn how to tune your business and improve your bottom-line.

More Design
Making money doesn’t happen by accident! Learn how to tune your business and improve your bottom-line.

More Design
Making money doesn’t happen by accident! Learn how to tune your business and improve your bottom-line.



Season 2: Spring Bootcamp for a Money-Making Summer
We've poured our 100+ combined years of hospitality experience into a series of live and recorded webinars that will be your bootcamp for a money-making summer.