
Best Hospitality Reporting Software
for Multi-Site Venues -The 2026 Guide
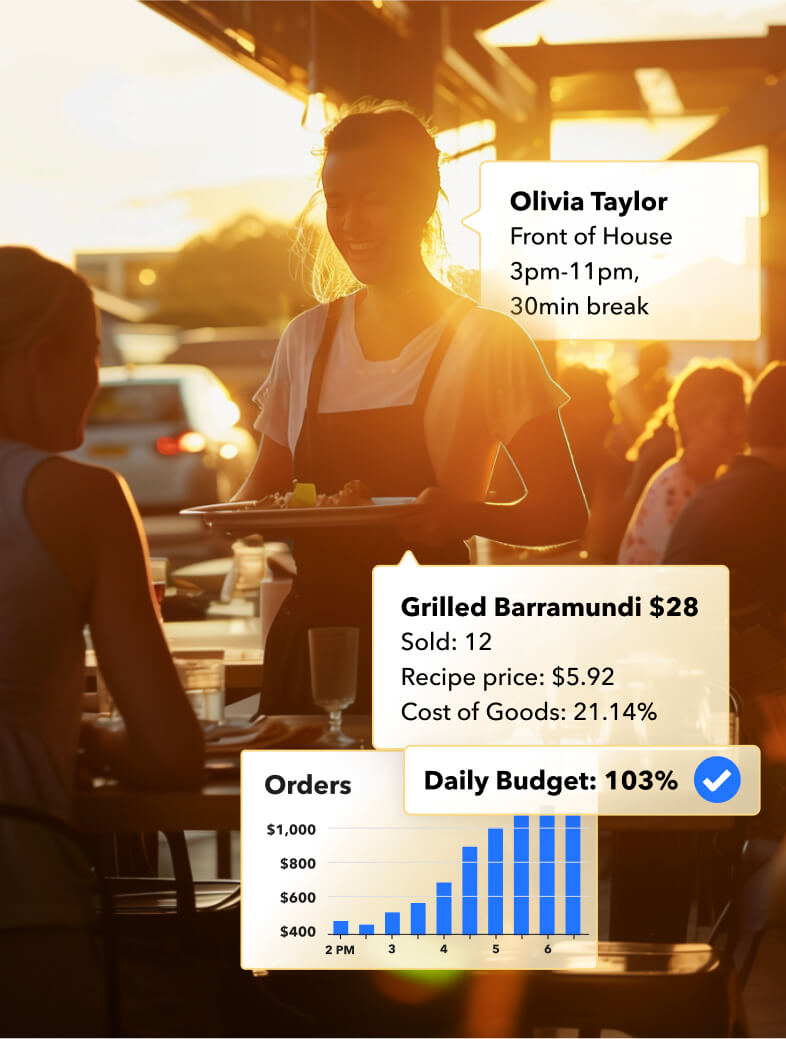
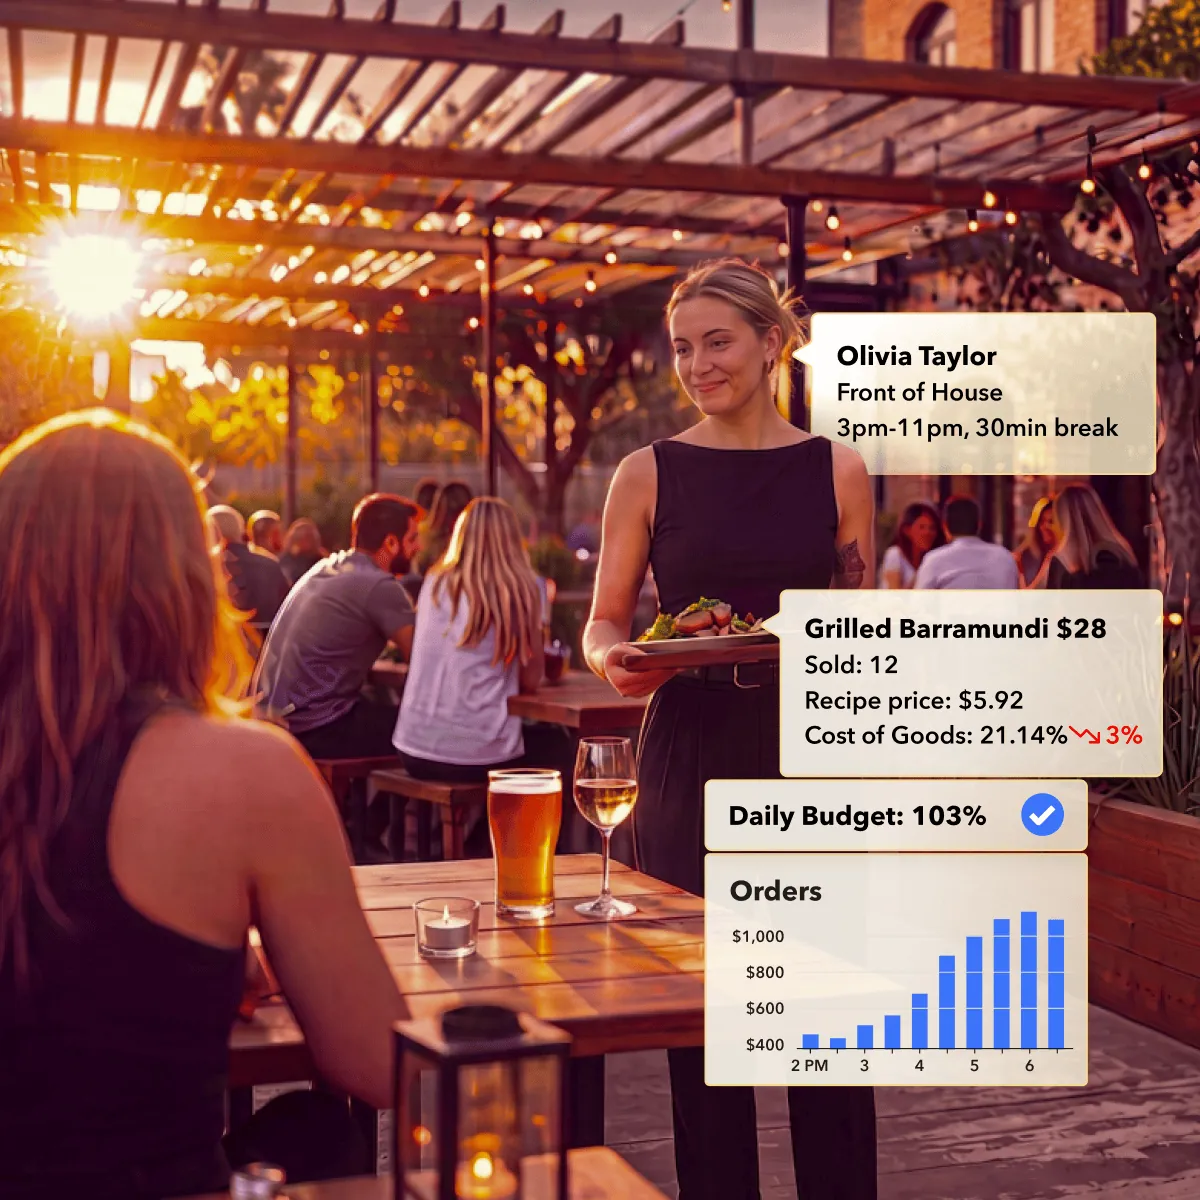







It's Monday morning, and you're staring at four different spreadsheets, one from each venue, trying to work out why site three had a great week on paper but somehow finished with a worse margin than site one. Reporting software is supposed to solve exactly this: pull revenue, labour cost and cost of goods data from every venue into one live, consolidated view, so you can compare site performance on the same basis without manually reassembling numbers every week. This guide covers what hospitality reporting software actually is, why multi-site operators end up flying blind without it, where most groups go wrong when they try to fix it, what a system built for this job should actually do, and how to tell the difference between a tool that reports on your business and one that helps you run it.
What is hospitality reporting software, and why do multi-site venues need it?
Hospitality reporting software is a system that pulls revenue, labour cost, and cost of goods data from every venue in a group into one live, consolidated view, so an operator can compare site performance on the same basis without manually inputting data from separate systems each week. Multi-site venues need it because the alternative, spreadsheets built and maintained by each site, doesn't scale past two or three venues before the versions stop matching and nobody fully trusts the numbers anymore. At one venue, you're close enough to the business to feel when something's off before the numbers confirm it. At four or five, that instinct stops working, and the gap between what you think is happening and what's actually happening starts to widen, often without anyone noticing.
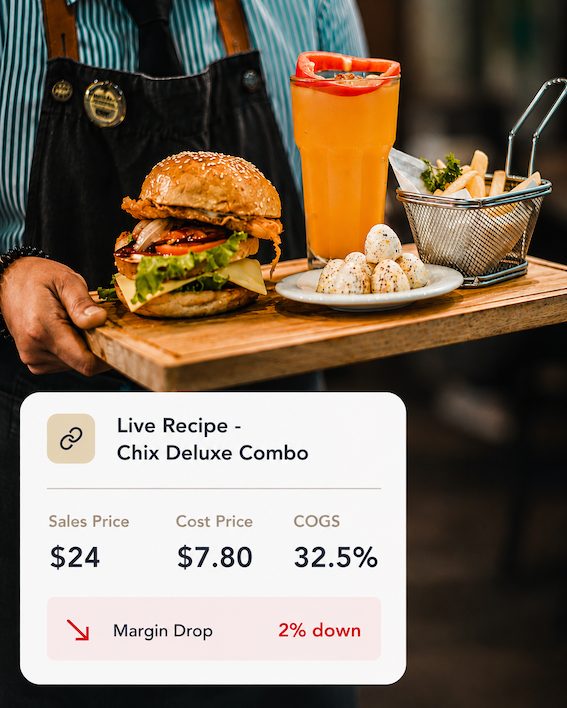
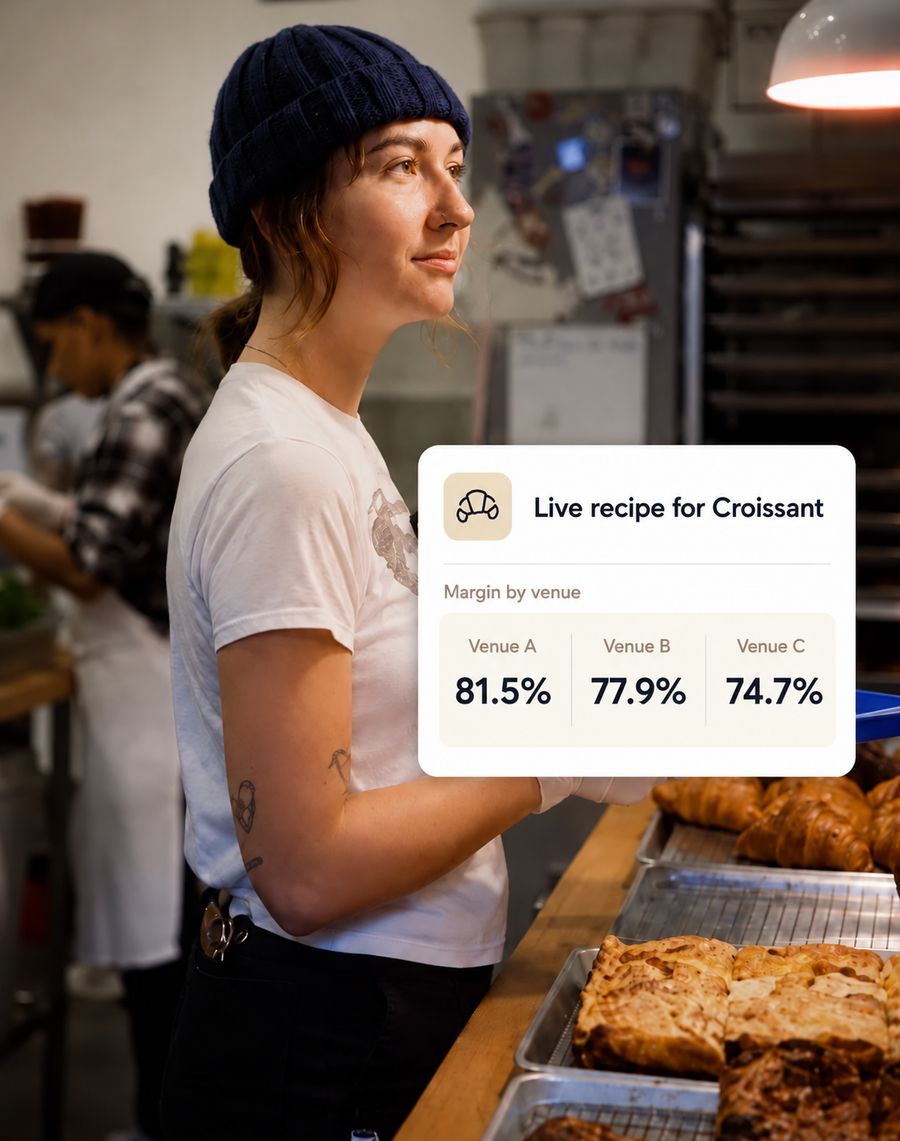
Why do multi-venue operators end up flying blind on performance?
Multi-venue operators end up flying blind because their revenue, labour, and cost of goods data live in separate systems that were never designed to talk to each other, so building one true view of the business requires someone to manually pull, reconcile, and reformat numbers from each site every single week, by which point the week being described is already over. A site running 4% over its labour target doesn't look dramatic in isolation, but without a weekly, side-by-side view across every venue, that overrun keeps running for months before anyone can say with confidence whether it's a rostering habit, a demand pattern, or a genuine problem. On $30,000 a week in revenue, a persistent 4% labour overrun is roughly $62,000 a year, at just one site. Expansion decisions get harder too: without consolidated, trusted data across existing sites, it's genuinely difficult to know whether the next venue is a smart bet or a way of spreading the same blind spots further.
What mistakes do most multi-site groups make when choosing reporting software?
The most common mistake is choosing software built for a different job entirely, either general financial consolidation tools built for accountants, or all-in-one restaurant platforms built for a different market, and then trying to bend it into an operational reporting tool for a growing Australian or New Zealand hospitality group. Platforms like Fathom and Syft Analytics are genuinely good at consolidating financial statements for accountants, but aren't built for the live, day-to-day view a venue manager or head chef needs. Platforms like Restaurant365 and SynergySuite are comprehensive but built primarily around US operations, payroll and compliance, leaving Australian and New Zealand groups paying for depth and complexity that doesn't fit their market. Buying on feature count instead of checking what a venue manager can actually do with the tool is another common trap, as is failing to check whether the numbers reconcile back to the POS, since a consolidated dashboard is only as trustworthy as the data feeding it.
What should multi-site hospitality reporting software actually do?
Good multi-site hospitality reporting software should show revenue, labour cost, and cost of goods for every venue, on the same basis, updated in close to real time, so an operator can see which sites are outliers the same day poor performance happens, rather than at the end of the month. That means consistent data across every site, percentages alongside dollar figures so venues of different sizes can be fairly compared, daily and weekly rather than monthly reporting, a variance-first view that surfaces the outliers rather than everything at once, and prime cost, food and beverage cost of goods plus labour as a percentage of revenue, tracked alongside the individual numbers. Most well-run hospitality groups in Australia and New Zealand target a combined prime cost below 60% of revenue.
- Single site and consolidated group reporting.
- Revenue, labour and COGS all driven from the same platform.
- Catch a problem location early, before it drags down the rest of the group.
How does Loaded solve multi-site hospitality reporting?
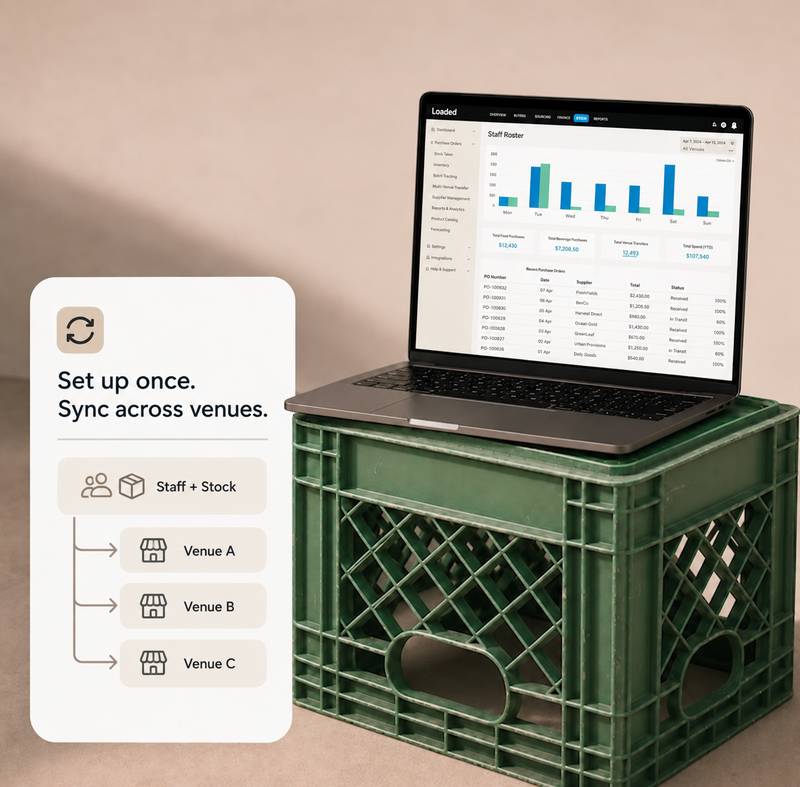
Loaded brings sales data in from each venue’s POS, while labour and cost of goods are managed directly within the same platform. This gives Australian and New Zealand hospitality groups one live, consolidated view of revenue, labour and COGS across every venue, rather than relying on a financial consolidation tool or a US-focused restaurant platform.
What's the best way to start improving reporting across your venues?
The best way to start is to pick the one number currently causing you the most pain, usually labour cost or cost of goods at your worst-performing site, and check whether you can see it clearly, on the same basis as every other venue, within the same week it happened.
- Start with your worst-performing venue and one metric, usually labour cost or cost of goods, rather than trying to fix reporting everywhere at once.
- Check whether that number is visible on a consistent, percentage basis against the rest of the group.
- If it takes longer than a week to see it clearly, that delay, not the number itself, is usually the first thing worth fixing.
What multi-site hospitality reporting software should actually do


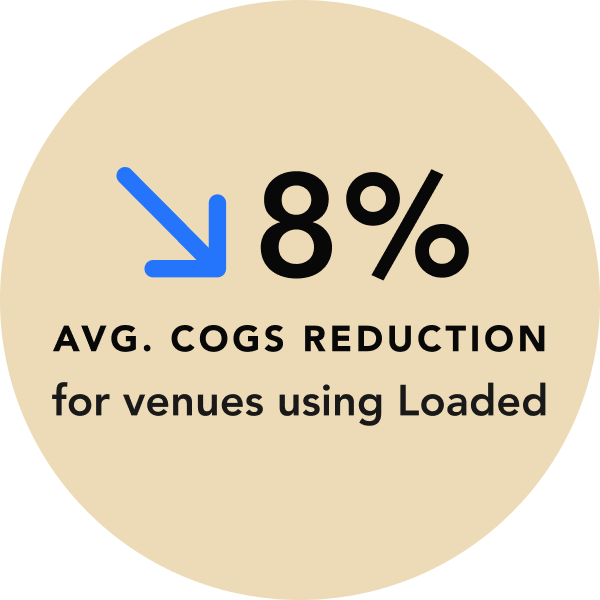
Aim for a combined prime cost below 60% of revenue
Food and beverage cost of goods plus labour, tracked together as prime cost, is the single most useful number for judging whether a venue is genuinely healthy, since a strong result on one metric can mask a weak result on the other.
Frequently Asked Questions
LOADED WORKS WITH LEADING POS





See it on your own numbers
Book a free, zero-pressure 30-minute demo and we'll walk through a single, live, cross-venue view using your own venues, not a generic pitch.
Book your demo
"Having everyone seeing and working from the same platform, very quickly turned into increased performance.
Multi-Site Reporting Doesn't Have to Mean Flying Blind
How long does it take to get Loaded reporting live across all my venues?
Most multi-site groups have consolidated reporting live within one to two weeks of kickoff, since Loaded connects to your existing POS and supplier systems rather than requiring you to change processes at each site first. Rollout time scales with venue and POS-integration count, not with how complex your reporting needs are.
Does Loaded work with the POS and accounting systems I already use across my venues?
Yes. Loaded connects to major hospitality POS systems, including Lightspeed, Tevalis, Idealpos, Bepoz and SwiftPOS, and syncs with your existing accounting setup, so you don't need every venue on the same POS before you get one consolidated view.
Can I trial multi-site reporting before rolling it out to every venue?
Yes. Most groups start with a 14-day free trial at one or two venues, usually the sites causing the most reporting pain, before extending it across the rest of the group. No credit card is required to start.
What does multi-site reporting cost with Loaded?
Pricing is per venue, per month, with a discount for annual billing, so cost scales with the size of your group rather than a flat enterprise contract. Talk to us for pricing specific to your venue count and POS integrations.
Who should be involved when rolling out reporting across multiple venues?
The most successful rollouts involve whoever owns the numbers day to day, usually an ops manager or finance lead, alongside one venue manager per site who can confirm the data matches what they see on the ground. Head office visibility matters, but the people running each venue need to trust the numbers too.