

Last month's P&L has just landed. Prime cost at one of your restaurants came in at 55%, the best result it's had all year. You let the manager know, and maybe you relax a little.
A month later the next P&L arrives and the same venue is at 67%. Same menu, same team, same trade. Now you're on the phone asking what went wrong, and nobody has a good answer, because nothing went wrong. Neither month was real.
We used to deal with these nasty financial surprises all the time across our 12-site hospitality group, and it is one of the most common stories we hear from multi-venue operators. It isn't that they don't track their venues. Most do, venue by venue, every month. The problem is three things stacked on top of each other:
- The numbers aren't accurate. Each venue's prime cost swings between great and terrible when the business performance actually hasn't moved.
- The venues aren't side by side. Numbers are spread across reports and spreadsheets, so it's hard to see quickly which venue actually needs attention and where.
- Every venue gets judged the same way. A cafe and a fine dining restaurant reach a prime cost by completely different routes, but they're often held to the same food or labour target.
Then, when operators do fix the accuracy, they often swing the other way: twenty reports, forty KPIs, and a team that is overwhelmed with information.
This guide is about getting the opposite. You want an accurate prime cost for every venue, read the right way for each type of venue, in one simple monthly view, with a daily check that keeps you on track in between. Get that dialled in and, in my experience, you'll be ahead of 95% of operators.
Key takeaways
- Prime cost is cost of goods plus total labour, as a percentage of revenue (excluding GST). Most well-run venues sit below 60-65%.
- If a venue's prime cost swings by several points with no change in the business, the number is inaccurate, not the performance.
- Different venue styles get to a healthy prime cost differently. Cafes run higher cost of goods and leaner labour. Fine dining runs the opposite.
- Compare venues side by side against their own targets, not against each other.
- Review a group P&L monthly, and use daily numbers (sales vs budget, labour vs sales) to stay on track.
What is prime cost, and why does it matter more than food or labour cost on their own?
Prime cost is your cost of goods sold (food and beverage) plus your total labour cost, shown as a percentage of revenue. It's the biggest controllable part of a hospitality P&L, usually 50 to 65 cents of every dollar you take, which makes it the best single number for telling you whether a venue is really making money.
The formula is simple:
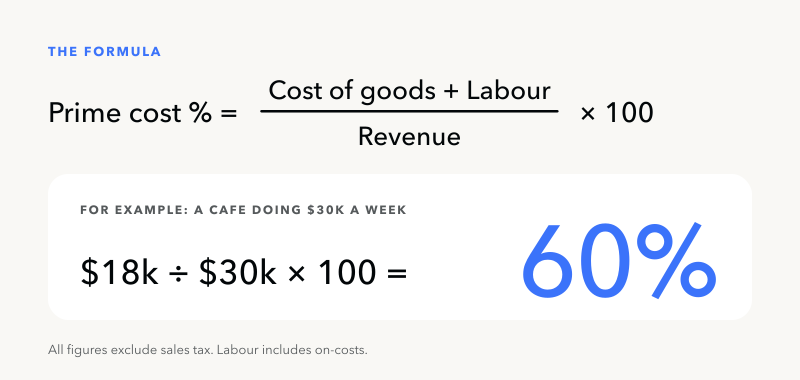
Prime cost % = (cost of goods sold + total labour) ÷ revenue (excluding GST) × 100
For example, a cafe turning over $30,000 a week, with $10,500 in cost of goods and $7,500 in labour (including on-costs), has $18,000 of prime cost. That's 60%.
The reason to watch the two together is that they trade off against each other. Look at food cost or labour on its own and it's easy to fix the wrong thing. Plenty of operators have pulled food cost down three points only to watch labour quietly climb four. The food cost report looks better, but the bank balance has gone backwards.
For the detail on each half, see how to calculate your labour cost percentage and what a good food cost percentage looks like in Australia.
Why does my prime cost look great one month and terrible the next?
If prime cost jumps all over the show from one month to the next and nothing in the venue has changed, the number isn't accurate. It's almost always a measurement problem, not a performance one. You're reading fiction, not fact.
Here's what that looks like for an example restaurant turning over $160,000 a month:
| Month | What the report said: prime cost | What it really was: prime cost |
|---|---|---|
| July | 55% | 61% |
| August | 67% | 61% |
Here's what happened in this example:
- July looked great. A batch of supplier invoices hadn't been entered by the time the month closed, and nobody did a stocktake, so cost of goods was worked out from purchases alone. It looked like 24%.
- August looked terrible. Those invoices landed in August and stock had run down, so cost of goods looked like 36%.
- The real number never moved. Cost of goods was 30% in both months. The venue sat at 61%, one point over its target, all the way through.
One manager got a bonus for a month that didn't happen. The next got grilled for a month that didn't happen either. And the one point that actually needed fixing never came up.
The usual causes are small and boring, which is exactly why they survive:
- Using purchases instead of usage. Cost of goods should be opening stock, plus purchases, minus closing stock. Purchases alone tell you when you bought, not what you used.
- Invoices in the wrong month, or not entered at all, or entered without anyone checking them against what was actually delivered.
- Stocktakes skipped, or done on different days at different venues.
- Supplier price changes nobody noticed. Recipe costs drift without anyone seeing it. Matt Goodison from The Lodge Bars put it well when he said those small misses can be the difference between running at a 75% margin and finding yourself at 69% before you've realised anything is wrong.
- Labour missing its on-costs. That means super or KiwiSaver, payroll tax, workers' compensation or ACC, leave accruals, or a pay run that falls across two months.
- Extra payroll periods. If you pay weekly, some months have five pay runs instead of four. If the wages aren't accrued to the right month, labour looks about a quarter higher that month, even though nothing in the venue changed.
- Stock moving between venues without being recorded, so one venue looks better and the other looks worse than reality.
None of these is dramatic on its own. But in a group they're everywhere and they stack up, which is why the number at month end so often turns into a nasty surprise.
Why do different types of venues have different prime cost mixes?
Each style of venue makes its money in a different way. A cafe typically runs a higher cost of goods and a lower labour cost. A fine dining restaurant is the opposite: a lower cost of goods and a much higher labour cost. Both can land in a healthy place. They just take a different road to get there.
A cafe is counter service, with fewer skilled roles and a high volume of relatively low-priced items. The coffee beans, milk and food make up a bigger share of each sale, so cost of goods runs high, but a lean team keeps labour low.
Fine dining flips that. You've got skilled chefs, careful plating, table service and often a sommelier. Menu prices are high relative to ingredients, and wine and cocktails help pull the overall cost of goods down. But all that skill and service shows up in the wage bill.
Pubs and casual restaurants usually sit somewhere in between.
| Venue type | Food cost % | Labour cost % | How it usually lands |
|---|---|---|---|
| Cafes and quick service | 28-35% | 20-25% | Higher cost of goods, leaner labour |
| Pubs and casual restaurants | 25-30% | 25-30% | Balanced between the two |
| Fine dining and full table service | 18-24% | 27-32% | Lower cost of goods, higher labour |
| Prime cost, any venue | Below 60-65%; strong operators 55% or lower | ||
Sources: Loaded's food cost and labour cost benchmark guides.
This matters a lot once you run more than one style of venue. If every venue is held to the same food cost target, or the same labour target, you'll chase the wrong one every month:
- A cafe at 34% cost of goods might be perfectly healthy, and a fine dining restaurant at 34% has a real problem.
- A fine dining venue at 31% labour might be running beautifully, and a cafe at 31% labour is over-rostered.
So set a prime cost target for each venue, and set the split between cost of goods and labour inside that target based on how that venue actually trades. We went deeper on each half in some of our earliest guides, 10 ways to slash your cost of goods and 5 ways to reduce labour cost in a bar or restaurant, and in our labour cost benchmarks by venue type.
How do you compare prime cost across multiple venues side by side?
Put every venue in its own column on one page. For each venue, show revenue, cost of goods %, labour % and prime cost %, next to that venue's own target and last year's result. Then add the dollars across to get a group total. You should be able to see in under a minute which venue is off, and whether it's the stock half or the labour half that's moved.
Here's an example month for a four-venue group:
| Venue | Revenue (ex GST) | Cost of goods % | Labour % | Prime cost % | Target (COGS / labour) | Gap | $ impact this month |
|---|---|---|---|---|---|---|---|
| Cafe | $120,000 | 35% | 25% | 60% | 60% (35 / 25) | 0 pts | $0 |
| Pub | $260,000 | 30% | 31% | 61% | 58% (30 / 28) | +3 pts (labour) | +$7,800 |
| Fine dining restaurant | $180,000 | 27% | 32% | 59% | 56% (24 / 32) | +3 pts (stock) | +$5,400 |
| Casual restaurant | $140,000 | 27% | 28% | 55% | 56% (28 / 28) | -1 pt | -$1,400 |
| Group (add the dollars) | $700,000 | 29.5% | 29.6% | 59.1% | 57.4% (blended) | +1.7 pts | +$11,800 |
At a glance, the group number of 59.1% looks fine. It's under 60%, after all. But against a blended target of 57.4%, built from each venue's own target, the group is $11,800 over for the month. And that money is coming from two venues with two completely different problems:
- The pub has a labour problem. Cost of goods is right on its model, but labour is three points over. That's a roster conversation, worth $7,800 this month.
- The fine dining restaurant has a stock problem. Labour is right on its model, but cost of goods is three points over. That's a conversation about portions, waste and supplier pricing, worth $5,400 this month.
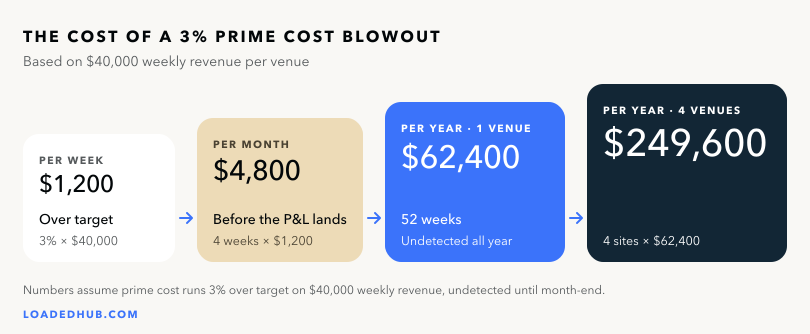
A three-point miss doesn't feel like much in any one week, which is exactly why it survives until the month-end P&L lands. On a venue doing $40,000 a week, here's what it adds up to if nobody catches it:
Now look at the cafe. It has the highest cost of goods in the group at 35%. If you ranked your venues on food cost alone, it's the one you'd call first, and it's the one venue sitting exactly where it should be.
One quick note on the group total: always add up the dollars across your venues and then work out the percentage. If you average the venue percentages, a small cafe gets the same say as your biggest pub.
How do you make sure each venue's prime cost is accurate?
Get the inputs right at the source. Count stock on the same day at every venue, enter and check every invoice in the month it belongs to (have a system that allows you to backdate them if they are ever missed), include every labour on-cost, and take GST out of revenue. Do that consistently and the big swings disappear, because the number starts reflecting what actually happened.
- Use the same cut-off for every venue. Same start date, same end date, same stocktake day.
- Work out cost of goods from usage, not purchases. You don't need a full count every week. Your top 20 items by spend usually hold most of the value, so count those weekly and do a full stocktake monthly. The Stock Playbook walks through how to set that up.
- Get every invoice in, checked and in the right month. If what was ordered, what was delivered and what you were charged don't match, your cost of goods is wrong before anyone counts a thing. Steve Anderson from Lott Cafe & Pha's Thai saw cost of goods go from 38% to 24% once they tightened up their inwards goods process.
- Include everything in labour. That covers penalty rates, overtime and leave as it's accrued. It also covers super (12% of ordinary time earnings in Australia since 1 July 2025) or KiwiSaver (a 3.5% employer minimum in New Zealand since 1 April 2026), plus payroll tax where it applies, and workers' compensation or ACC.
- Record stock that moves between venues, so each venue carries its own cost.
Accurate doesn't mean perfect to the cent. It means consistent enough that when the number moves, you know the business moved.
Why does more reporting make it harder to manage a hospitality group?
Once your numbers are accurate, it's tempting to report on everything. But a team looking at forty numbers doesn't know which three matter. More reporting feels like more control, but it usually leads to less action. The goal is the fewest numbers that tell you exactly where to focus.
It tends to creep up on you. A report for wastage, another for discounts, a labour report by hour, a sales report by category, a KPI dashboard on top. Each one is useful on its own. Together they're a wall of numbers:
- Managers spend Monday morning building reports instead of being on the floor.
- Nobody reads past page two.
- The management meeting turns into a debate about which report is right.
The fix isn't less information. It's a clear rhythm, where you look at the right few numbers at the right time.
What should a multi-venue group review monthly, and what should it check daily?
Once a month, review one consolidated P&L with every venue side by side against budget and last year. Every day, check a handful of live numbers per venue, mainly sales against budget and labour against sales, so you can act while the month is still in play. Every week, check prime cost by venue using your top-item stock counts.
| How often | What you look at | Who owns it | Where it lives |
|---|---|---|---|
| Daily | Sales vs budget, labour vs sales (the daily labour rule), invoice and price alerts | Venue managers | Loaded |
| Weekly | Prime cost by venue, using top-20 item stock counts | Venue managers and group GM | Loaded |
| Monthly | Every venue side by side: actual vs budget vs last year, against each venue's own target | Owners and group GM | Group P&L template |
Monthly: the Group P&L. Our multisite Group P&L template is built for exactly this:
- Every venue sits in its own set of columns: actual, budget and last year.
- Head office has a column of its own.
- The group total adds up automatically across the page.
It took us years of trial and error to land on that layout, and it gives you just what you need once a month, no more and no less. It's also where your venue targets live. That way you can see each venue against its own model, not against the venue next door.
Daily: the numbers that keep you on track. The monthly P&L tells you how you went. The daily check is what changes how you go. The habit that made the biggest difference across our 12 venues was giving each manager a daily sales budget and a simple rule for labour:
- If sales are ahead of budget, bring labour in under the percentage target for the day.
- If sales are behind budget, bring labour in under the rostered dollar amount.
Run that every day and soft weeks stop wiping out good ones. For us, focusing on this was worth around $30,000 a year for every $1 million in revenue.
On the stock side, the daily job is catching things as they happen: invoices processed by Loaded AI as they arrive, and supplier price changes flagged by AI as they’re received, not at month end.
How does Loaded help keep prime cost on track every day?
Loaded brings sales from your POS, labour from your rosters and timesheets, and cost of goods from your invoices and stocktakes into one place for every venue. Prime cost is calculated the same way at every site and kept up to date as the month goes on. It's the daily driver between your monthly P&Ls.
We built Loaded because we hit exactly these problems running our own group of 12 venues. Our numbers were late, they didn't always match, and by the time we knew whether a week had been good or bad, it was already over. Once revenue, labour and cost of goods were in one place, live and consistent across every site, our net profit moved from around 5% to 13 to 14%.
That wasn't from a jump in sales. It came from finally seeing what was happening while there was still time to do something about it.
In practice, that means:
- Labour against sales, every day, for every venue, so managers can run the daily labour rule without building a spreadsheet.
- Invoices processed automatically and checked as they land, with alerts when a supplier's price changes. This is the accuracy fix for the cost of goods half.
- Every venue compared side by side, on sales, labour and stock, using the same definitions everywhere.
The monthly Group P&L gives you the big picture, and Loaded makes sure there are no surprises when it arrives.
How do I start fixing prime cost across my venues?
Start by checking whether last month's prime cost was real. Pull the last three months for each venue. If a venue's prime cost swings by more than three or four points, you've likely got an accuracy problem, not a performance one.
From there:
- Fix the inputs using the checklist above: same cut-off, usage not purchases, every invoice checked, full labour on-costs.
- Set a target for each venue that matches how it trades, with its own split between cost of goods and labour.
- Lay your venues out side by side once a month using the Group P&L template.
- Pick the few daily numbers your managers own, and drop the rest.
Get those four things dialled in and you'll be ahead of 95% of operators. Not because you're doing anything complicated, but because you're working from fact instead of fiction, and you know exactly where to look.
Here's where to go next:
- If you're working out which system should hold all of this, our guide to hospitality reporting software for multi-site venues covers what to look for.
- If you're mid-rollout, seven multi-venue reporting implementation challenges covers the common traps.
- If you're comparing options now, see how Loaded stacks up as a Supy alternative or a Restoke alternative.
Prime cost FAQs
How do you calculate prime cost across multiple venues?
Add up the cost of goods and total labour in dollars for every venue, add up revenue (excluding GST) for every venue, then divide total prime cost by total revenue. Always add the dollars first and calculate the percentage last. Averaging each venue's percentage gives a small venue the same weight as your biggest one.
Does prime cost include salaries and on-costs?
Yes. Labour in prime cost covers everyone working in the venue, including salaried managers and head chefs, plus penalty rates, overtime, leave as it accrues, super or KiwiSaver, payroll tax where it applies, and workers' compensation or ACC. Leaving on-costs out makes a venue look healthier than it is.
Should head office costs be included in venue prime cost?
Usually not. Keep head office wages and costs as their own line in the group P&L, so venue managers are measured on costs they control. If you do allocate them, use the same rule every month.
What's the difference between prime cost and gross profit?
Gross profit is revenue minus cost of goods. Prime cost adds labour to cost of goods, so it shows how much of every dollar goes on the two biggest costs you control. A venue can have a great gross profit and still be in trouble if labour is running high.
How often should you calculate prime cost?
Check labour against sales daily, prime cost by venue weekly (using counts of your top items), and the full group P&L monthly. Waiting for the monthly P&L means the month you want to fix is already over.
Why can a group's prime cost look fine when one venue is struggling?
Strong venues hide weak ones. The group number is weighted by revenue, so a big, efficient venue can absorb a smaller one running several points over target for months. That's why each venue needs its own target, side by side.
Want to see your own venues side by side, with numbers you can actually trust? Book a free, zero-pressure 30-minute demo and we'll walk through your current setup, not a generic pitch.
See how Loaded can work for your business
If you’ve never seen Loaded in action, jump over and book a demo with us. 30 minutes is all we’ll need to show you the magic!


More Profit
Making money doesn’t happen by accident! Learn how to tune your business and improve your bottom-line.



More Success Stories
Get inspired by stories from real Loaded customers who run thriving hospitality businesses.




More Labour
Get tips for optimising your staff’s time, and for managing your team effectively.


.jpg)
More Culture
Making money doesn’t happen by accident! Learn how to tune your business and improve your bottom-line.



More Design
Making money doesn’t happen by accident! Learn how to tune your business and improve your bottom-line.

More Design
Making money doesn’t happen by accident! Learn how to tune your business and improve your bottom-line.

More Design
Making money doesn’t happen by accident! Learn how to tune your business and improve your bottom-line.



Season 2: Spring Bootcamp for a Money-Making Summer
We've poured our 100+ combined years of hospitality experience into a series of live and recorded webinars that will be your bootcamp for a money-making summer.