Under the Stock tab, use Stock Overview to see a breakdown of all orders and the suppliers they're coming from, over a day, week or month.
You need Stock permission to view this report. If you don't have access, ask someone with Manager permissions to update your access.
You need to be using the Loaded ordering system for this overview to work.
To access, head to Stock → Stock Overview.
This report provides an overview of all food & beverage purchases made through Loaded.
The first bar graph shows food & beverage purchases made each day. Hover over a blue bar with your cursor to see the dollar figure for that purchase.

Below that is a total for food purchases, beverage purchases, the total number of orders and an average purchase value for the week.

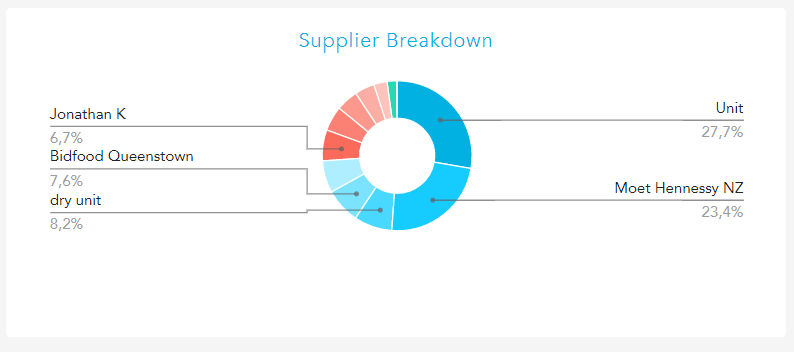
The pie graph shows a breakdown of purchases by supplier as a percentage of total purchases — hover over each section to see the dollar value.
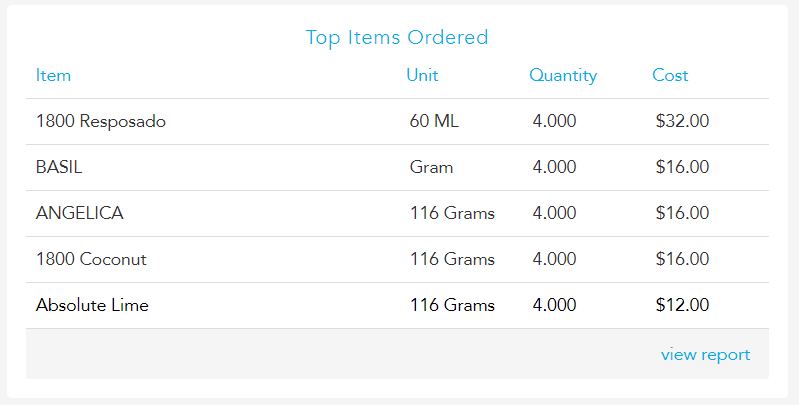
Finally, you can see the top 5 ordered items for the week by quantity and cost. Click View Report to see the full orders by item report.