You may notice there is a discrepancy between your Orders & Sales totals in Loaded. Below is a description of how each figure is calculated:
Orders - This is the total amount of purchases before discounts, voids and outstanding tabs. If there is a $250 table still dining it will show in orders but not sales.
Sales - These are all the tenders you have received. Including all cash sales, and TABs that have been paid, after discounts and voids have been applied.
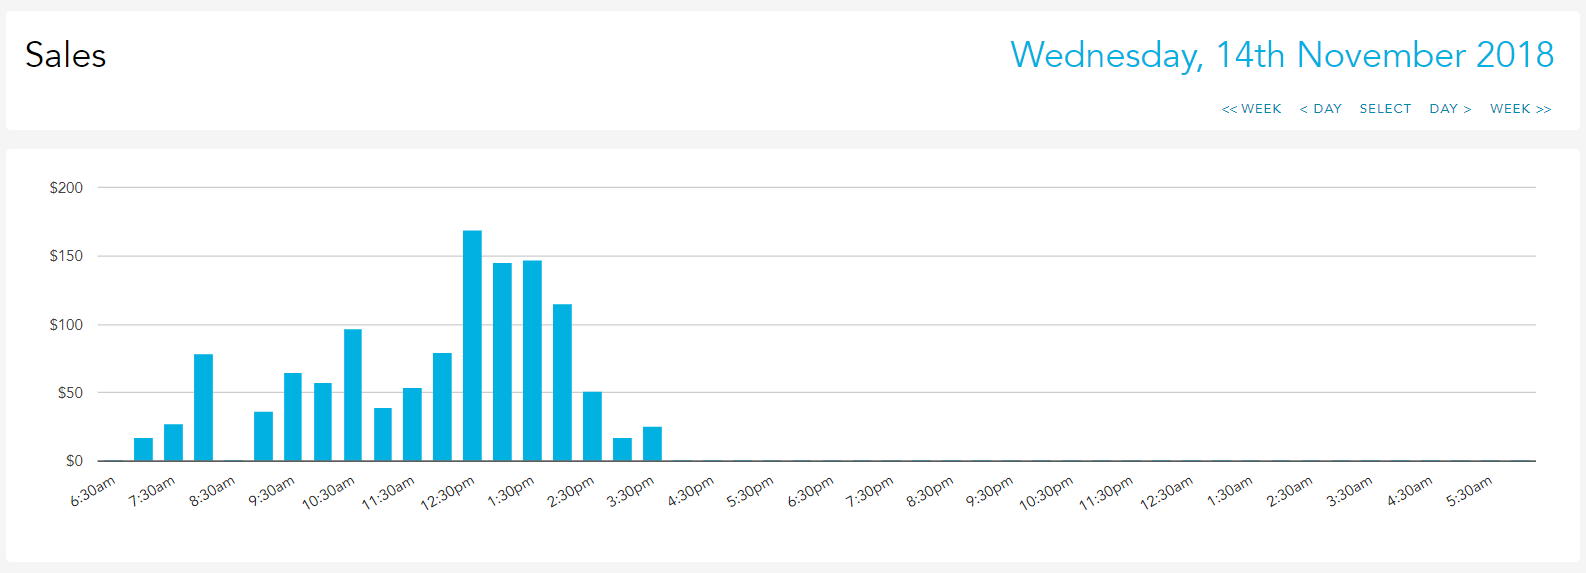
Your sales overview gives you total orders, sales, budget and other useful information for one site. Multi-site users need to ensure they've selected the correct site from the drop-down menu at the top of the page. At the bottom of the page, you'll also see the top sales staff for the day, as well as the food/beverage breakdown. You can select "Orders" (sales before discounts, voids and outstanding TABs) from the menu on the left.
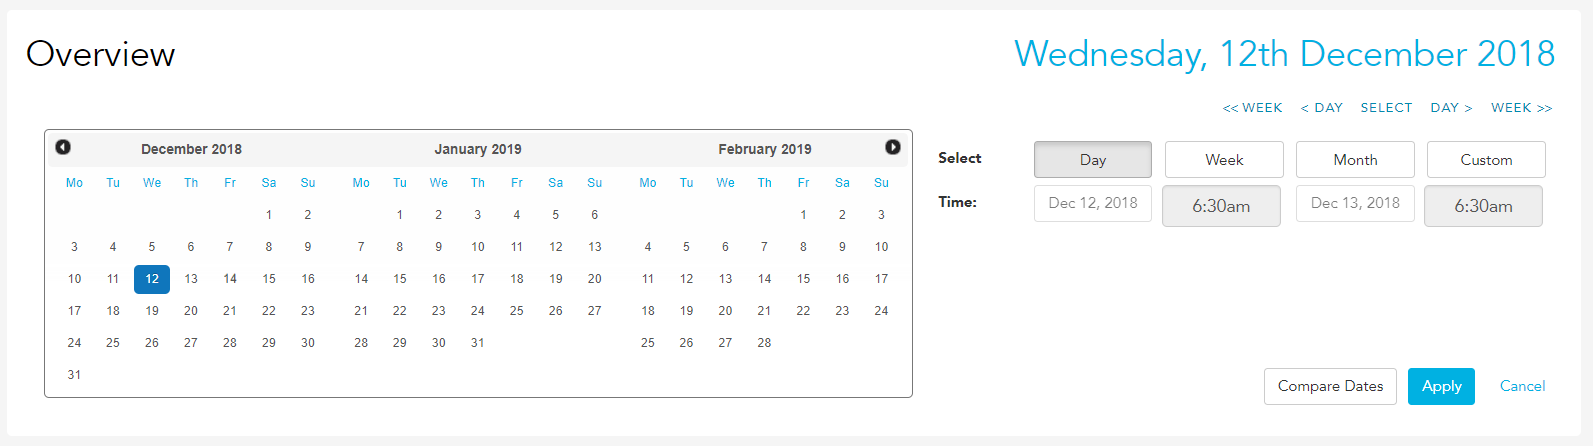
Remember, you can select your report period (day, week or month) at the top of the screen. You can also navigate between days, weeks and months here.
Transactions
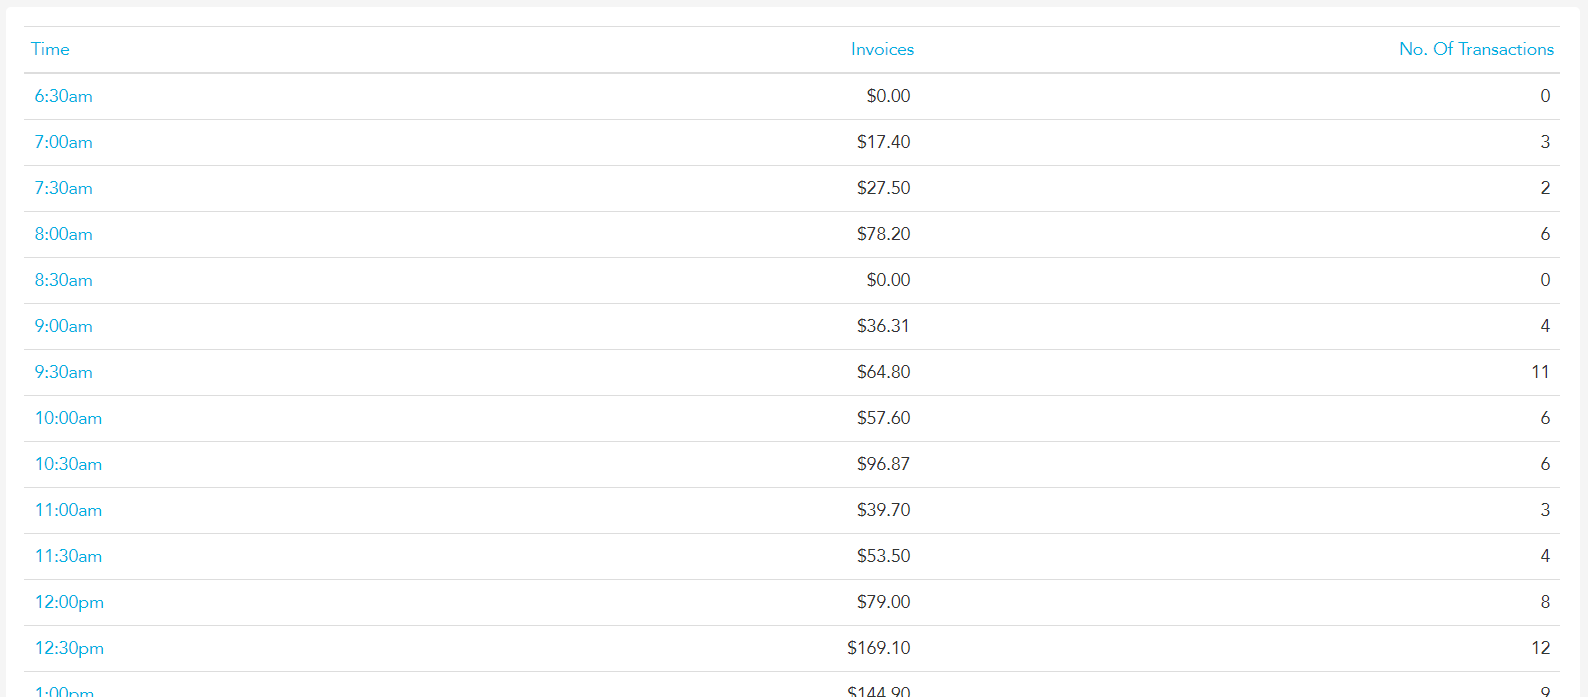
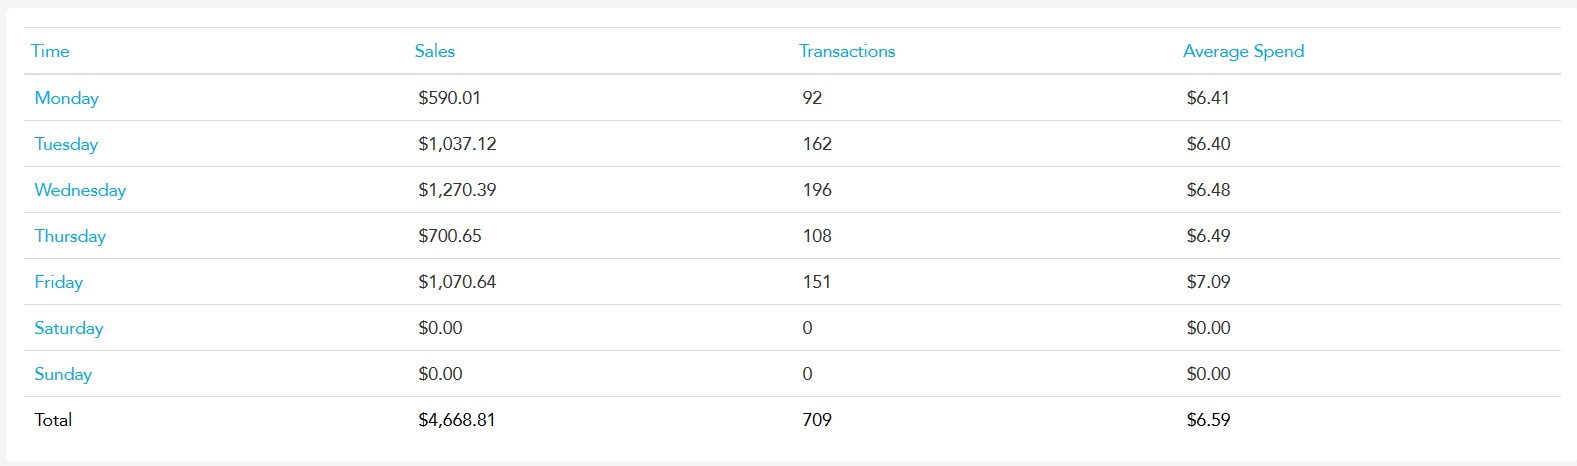
The transaction report shows how many individual transactions you had in a specific half-hour period. If you select "Week" or "Month" each day's total transactions will be displayed. Great for finding out when your staff is truly being pushed.
Average Spend
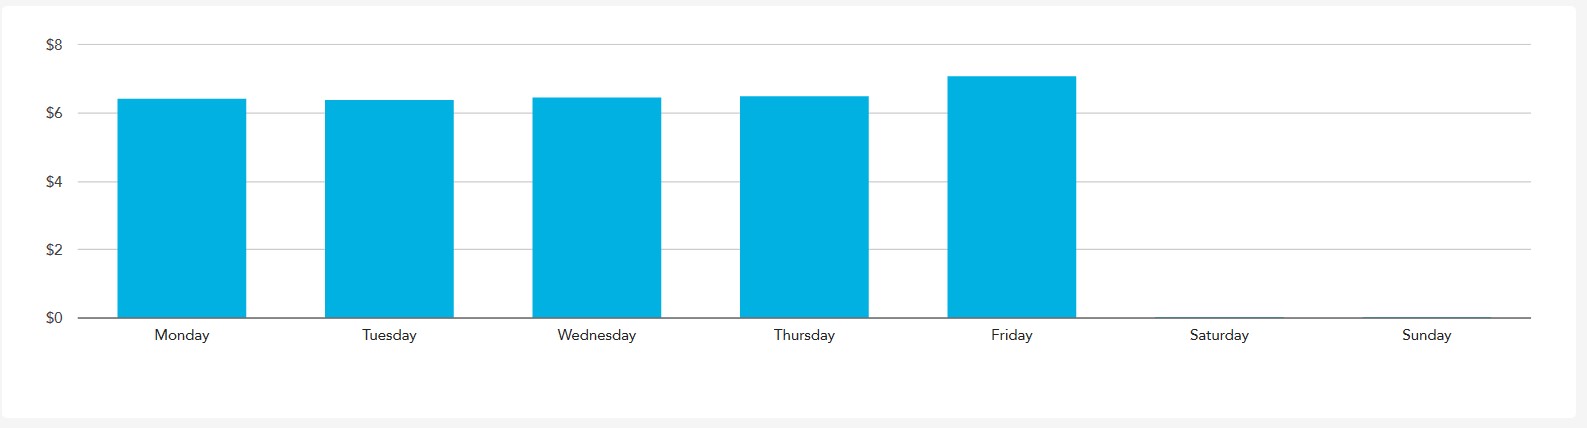
The average spend report shows you the average transaction value across each half-hour or day. This is valuable to see when you are at your most efficient. There may be a particular promotion or special which drives your average transaction value down; see by how much in the average spend report.
Tables
The tables report shows you exactly how many "tables" (or tabs) have been opened. Loaded then breaks the information down further, giving you the total spend from the tables, the number of customers at those tables (or on the tabs), the average spend per table, and per customer at the tables.
Budget vs Actual
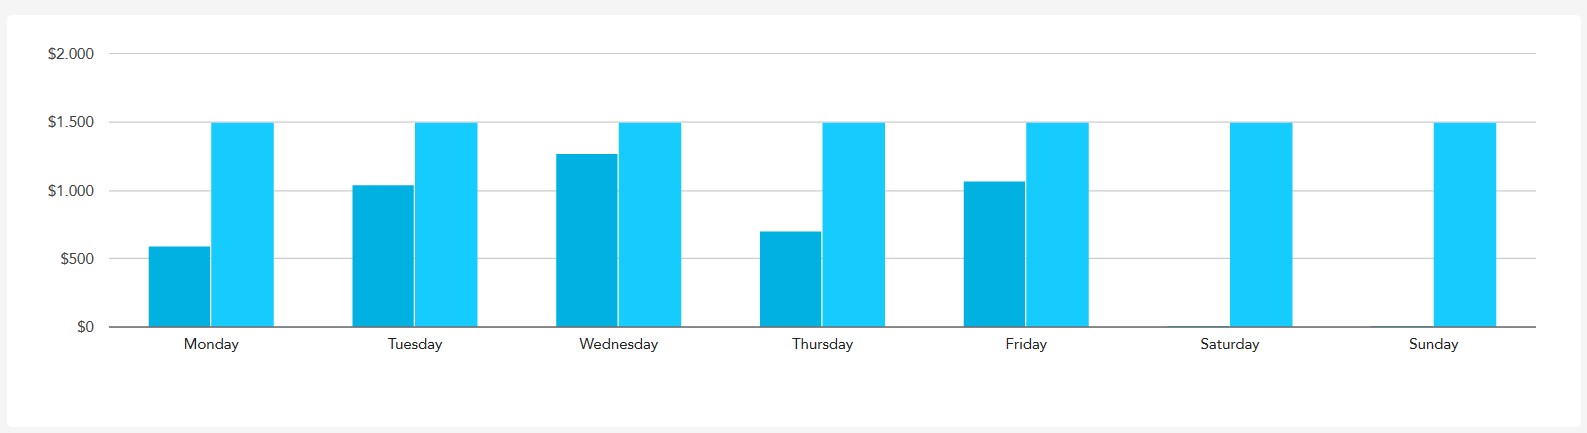
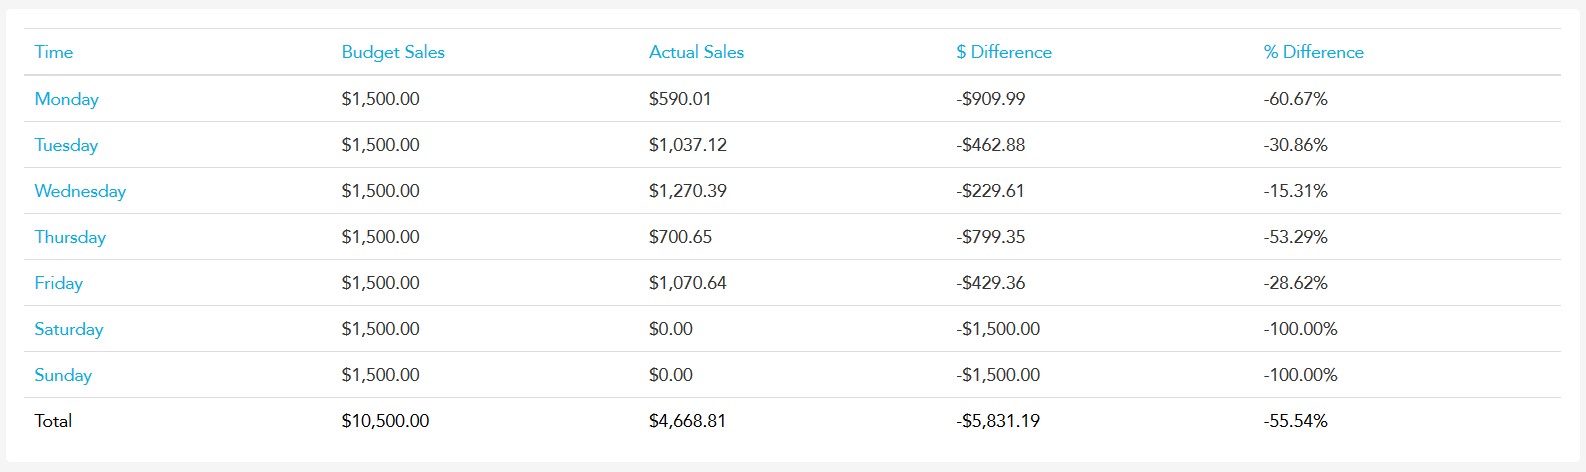
This report shows you your budget tracking for the day, week, or month, and the percentage above or below budget your sales are currently. Below is a weekly budget vs actual, making it easy to identify exactly where your major "over budget" or "under budget" events may have occurred.
Food vs Beverage
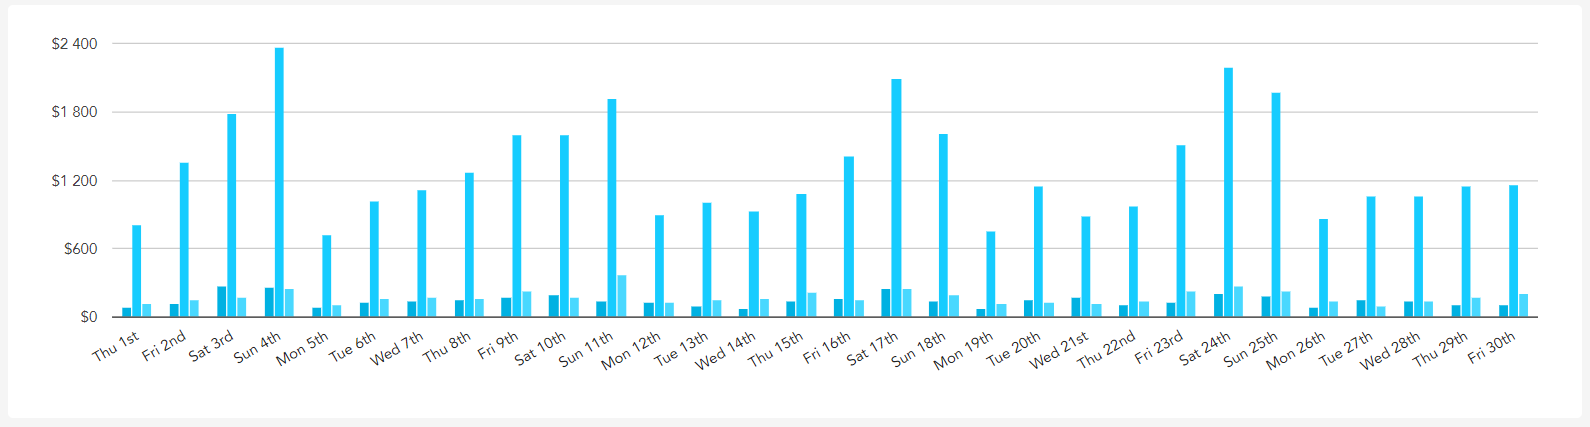
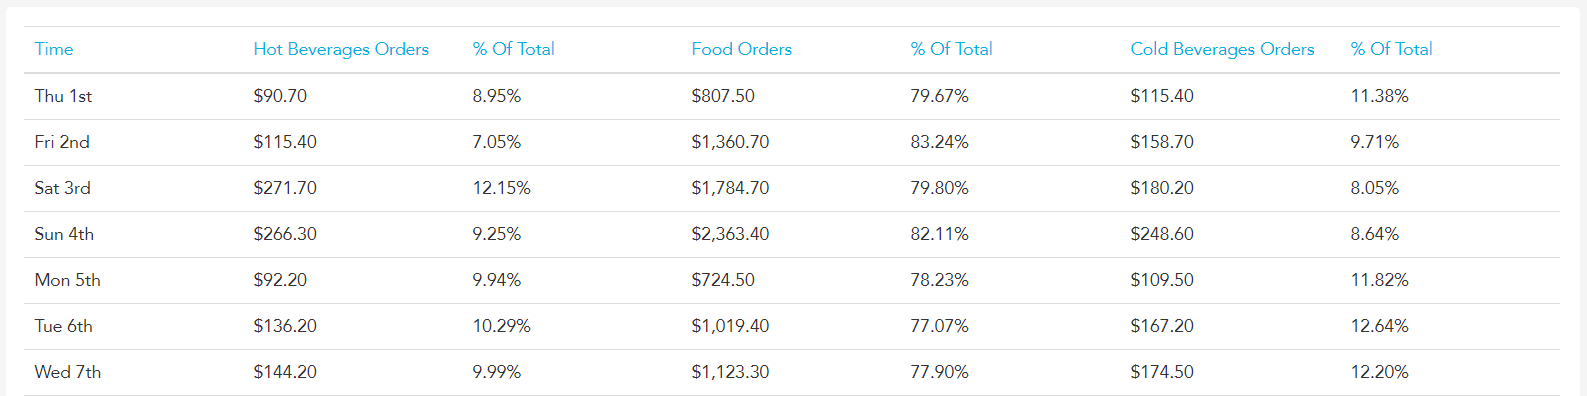
In the Food vs Beverage report, you can see a breakdown of exactly when you are selling the most food/beverage as a percentage and a sales figure. For example, a site might sell a lot more beverages on Wednesday than Monday. As a higher GP product, you might push your team to then "hit 50% beverage sales" on Monday.