
You'll need Reports permission to view this page. If you don't have access to this module, ask someone with Manager's permission to update your user permissions.
Your data importer will need to be running and connected to the internet on your server computer for information to show in this report.
To get the most out of this report, it'll help if you've set up individual staff logins for each staff member on your tills.
The staff cost page in this report will only show data if you're using the timeclock function in Loaded.
If you'd like to customise the time frame of any of these reports, follow the steps for setting a custom date range.
To access, head to Reports and Staff.
Overview
The Invoices by Staff pie chart breaks down the total number of orders processed by each staff member as a percentage of all orders placed. Hover over any section to see the dollar value.
Below that are dollar totals for sales, discounts, staff cost, and voids processed so far today. Click on any total to dig deeper into that day's reports.
The Top Staff Orders list shows which staff accounts on your tills are processing the most orders, in dollar value and as a percentage of total orders placed.
The Staff Cost Ratio chart shows your staff cost as a percentage of total sales made. Hover over the chart to see the dollar value for each portion.
Orders
Orders are the total amount of purchases before discounts, voids, and outstanding tabs. For example, if there's a $250 table still dining, it'll show in orders but not sales.
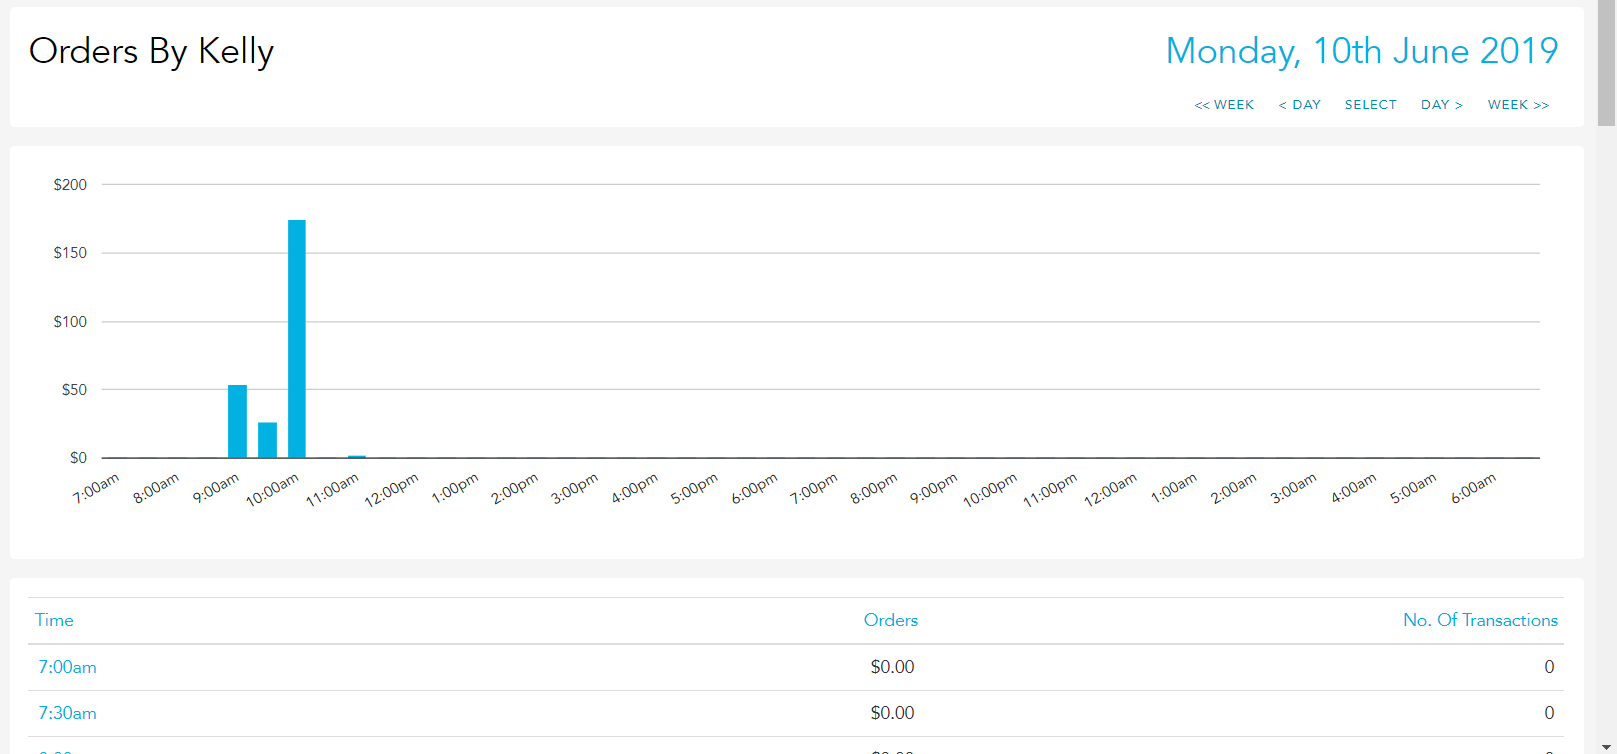
This report shows the total number of orders placed by each staff member, as a percentage of total orders placed. Hover over any section to see the dollar value.
Each staff member is listed with orders as a dollar figure, percentage of total, number of transactions processed, and average transaction value, so you can identify who's creating the most efficiency for your business.
Click a staff member's name to drill into their half-hourly orders; hover over the bars to see the dollar value for each half hour, or click a half-hour period for more detail on products ordered.
Sales
Sales are all the tenders you've received, including cash sales and paid tabs, after discounts and voids have been applied.
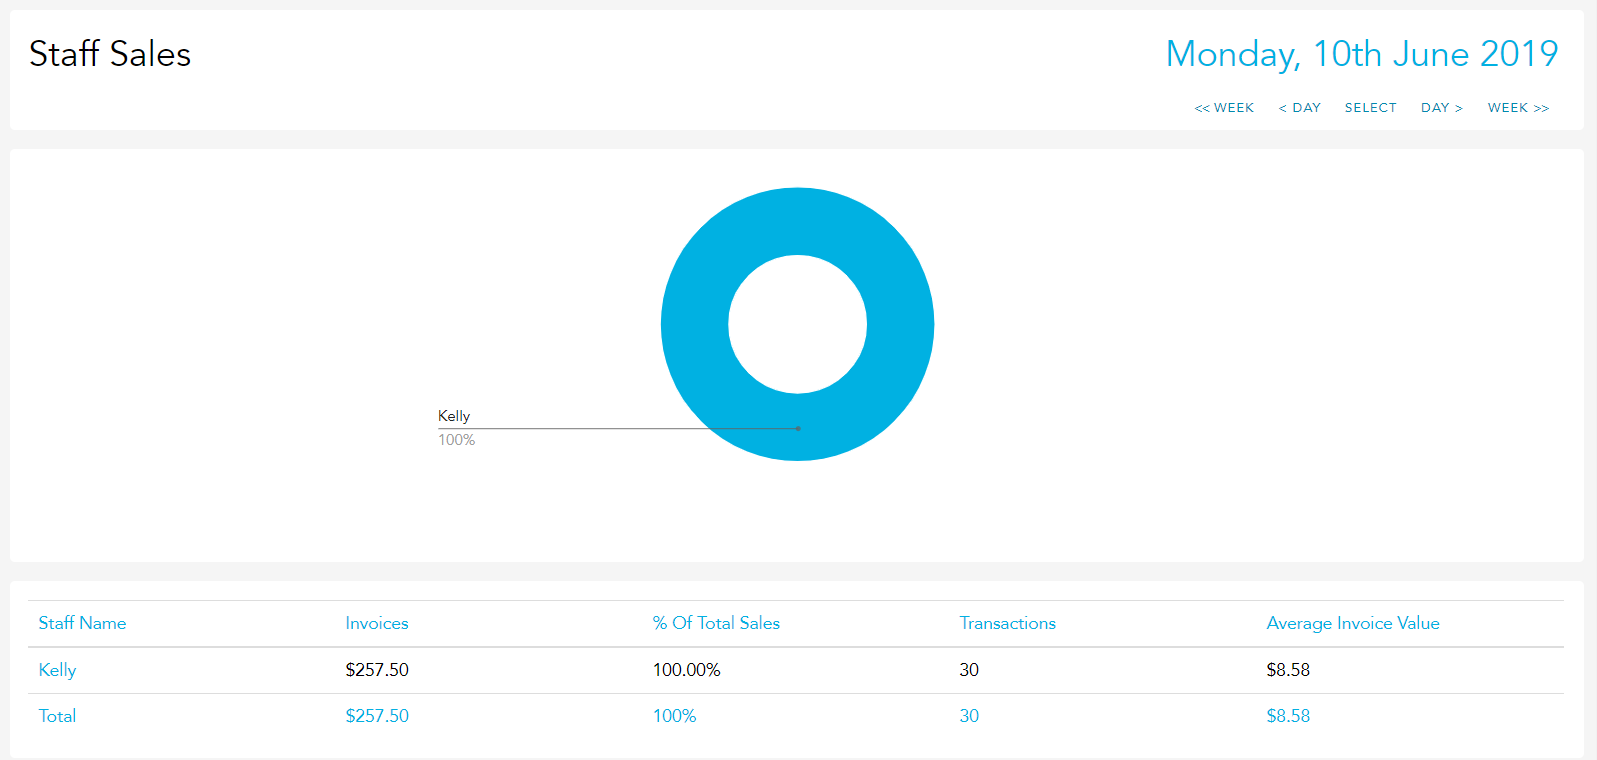
This report shows the total number of sales processed by each staff member, as a percentage of total sales made. Hover over any section to see the dollar value.
Each staff member is listed with sales as a dollar figure, percentage of total, number of transactions processed, and average transaction value.
Click a staff member's name to drill into their half-hourly sales; hover over the bars to see the dollar value for each half hour, or click a half-hour period for more detail on products sold.
Items & Item Groups
These reports break down which staff are selling the most and least of specific menu items, and which categories or item groups these products come from.
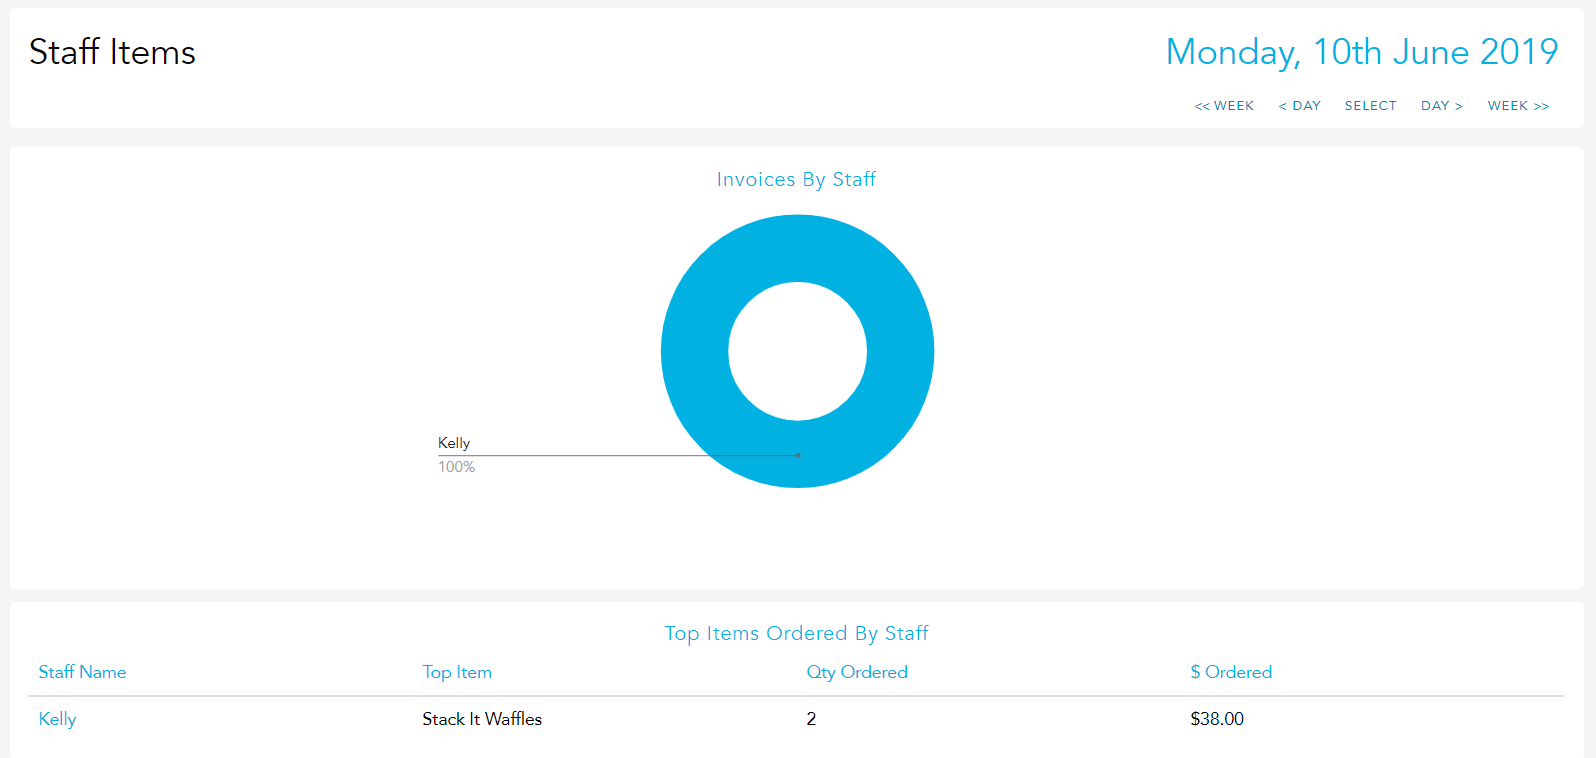
The Invoices by Staff pie chart breaks down the total number of orders processed by each staff member as a percentage of all orders placed.
Below that, each staff member is listed with their top item sold, category sold from, number of items ordered, and the dollar value.
Click a staff member's name to break down each menu item or item group, showing how many times they processed orders for it, the dollar value, and percentage of all orders.
Staff Cost
The staff cost reports give you a visual picture of your staffing costs over the day, week, or month, drawn from staff clocking in and out using Loaded.
Hover over the bar for each half-hour period to see the dollar value.
Below this you'll see the total cost for each staff member, as well as a total for the day.
Discounts
This report shows exactly which discounts are being used, by which staff members, and at what times.
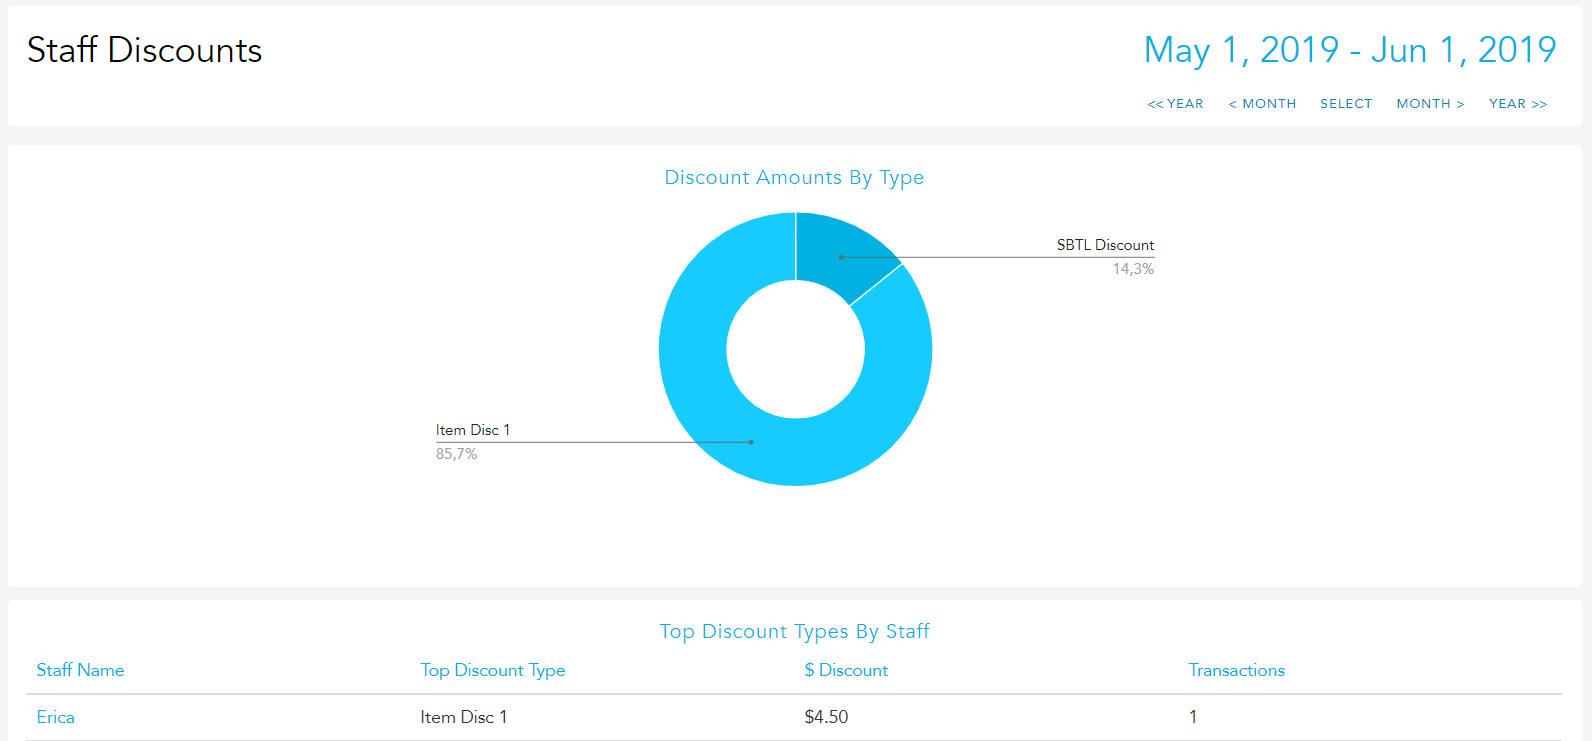
The Discount Amount by Type chart breaks down which discounts have been used as a percentage of total discounts. Hover over any section to see the dollar value.
Each staff member is listed with their top discount type used, the dollar value, and the number of transactions discounted.
Click a staff member's name to break down each discount type and the dollar value associated with discounts and sales value.
Voids
The voids report displays all transactions voided off the tills and which staff members processed them.
The Voids by Reason chart breaks down each reason staff have used when voiding items, as a percentage of total voids. Hover over any section to see the dollar value.
Each staff member is listed with their top void reason used, the dollar amount voided, the number of items voided, and the dollar and quantity marked as wastage.
Click a staff member's name for the quantity and dollar figure of voided and wasted items processed under their account on the tills.