
You'll need Reports permission to view this page. If you don't have access to this module, ask someone with Manager's permission to update your user permissions.
Your data sync will need to be running and connected to the internet on your server computer for information to show in this report.
To get the most out of this report, it'll help if you've created a budget in Loaded.
If you'd like to customise the time frame of any of these reports, follow the steps for setting a custom date range.
To access, head to Reports then Revenue.
Overview
The Orders graph breaks down the number of orders processed across each half hour. You can see the dollar value by hovering over the bar with your cursor.
Below that are dollar totals for orders, sales, your budget, number of transactions, and average sale value processed so far today. Click on any total to dig deeper into that day's reports.
The Top Staff Orders list shows which staff accounts on your tills are processing the most orders, in dollar value and as a percentage of total orders placed.
The Item Category Orders chart shows how your orders are split across categories from your tills, as a percentage of total orders placed. Hover over the chart to see the dollar value for each portion.
Orders
Orders are the total amount of purchases before discounts, voids, and outstanding tabs. For example, if there's a $250 table still dining, it'll show in orders but not sales.
In day view, hover over the bars on the Orders graph to see the total dollar value of orders placed in each half-hour period.
Click on a half-hour period to see the items ordered and their cost, then click an individual order for further details.
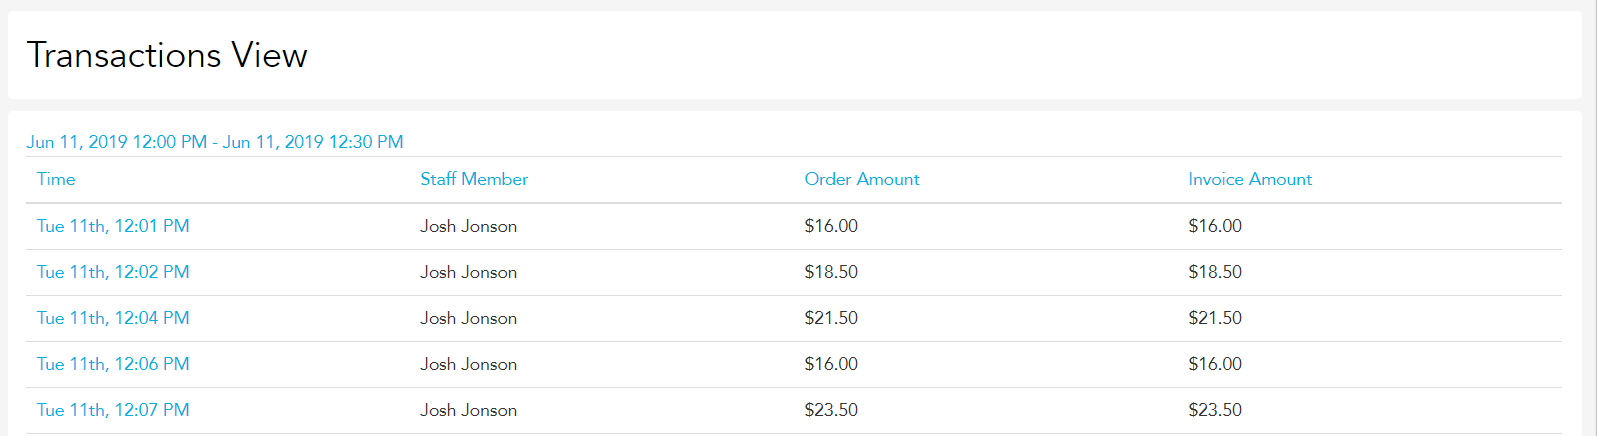
In week or month view, the bars reflect daily orders rather than half-hourly.
Sales
Sales are all the tenders you've received, including cash sales and paid tabs, after discounts and voids have been applied.
In day view, hover over the bars on the Sales graph to see the dollar value of sales processed in each half-hour period.
Click on a half-hour period to see the items sold and their cost, then click an individual sale for further details.
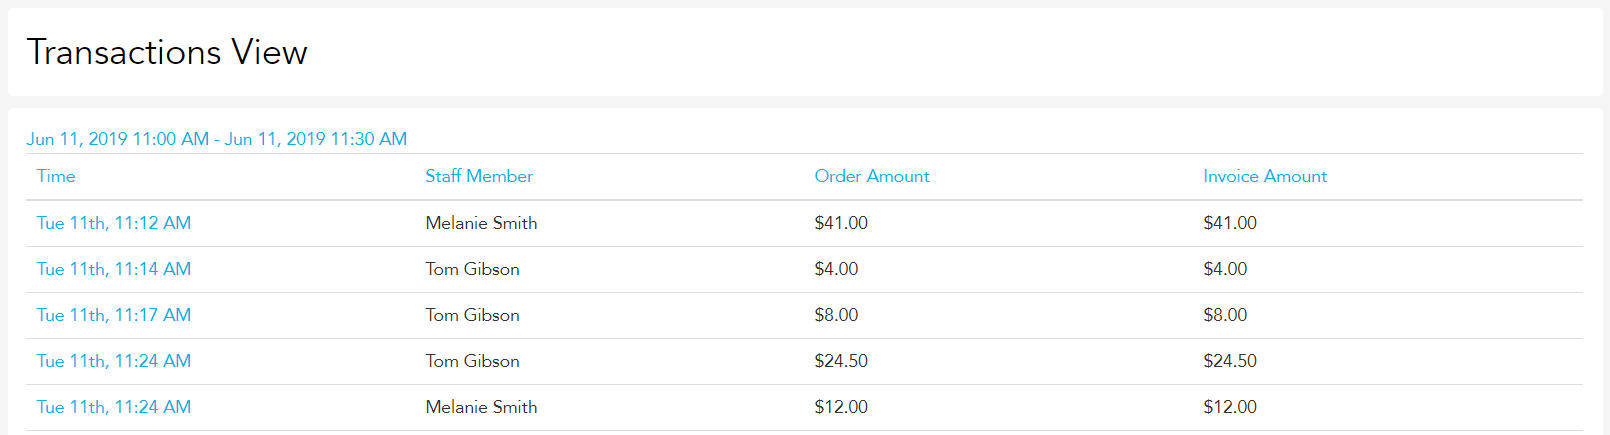
In week or month view, the bars reflect daily sales rather than half-hourly.
Transactions
In day view, hover over the bars on the Transactions graph to see the number of transactions processed across each half-hour period.
Below the graph, each half-hour period is broken down to show the number of transactions and the average transaction value.
In week or month view, each day's total transactions are displayed instead.
Average Spend
In day view, hover over the bars on the Average Spend graph to see the average transaction value across each half-hour period.
Below the graph, each half-hour period is broken down to show total sales value, number of transactions, and average transaction value.
In week or month view, each day's average spend is displayed instead.
Budget vs Actual
This report shows your budget tracking for the day, week, or month. The dark blue bar shows your actual sales value, and the light blue bar shows your budgeted sales value.
Below the graph, each day is mapped to show actual sales value, budgeted sales value, and the difference between the two in both dollar figure and percentage.
Click on a day to see the same data mapped out by individual days of the week.
Food vs Beverage
This report maps your food and beverage purchases against one another. The dark blue bar shows your food orders, and the light blue bar shows your beverage orders.
Below the graph, each day is mapped to show the total for each category in dollar values and as a percentage of total orders, with a total for the week as a whole.
Tables (Bepoz, Swiftpos & Wizbang customers only)
This report maps the number of tabs or tables opened against the number of sales and customers on those tables, giving you your average sales per head figure.